Note: This blog contains data obtained from the US Census that delineates voter trends based on age, race, and gender. While valuable data is shown, not every racial, ethnic, or gender identity is represented.
At the League, we've always known that Women Power Democracy — and our last report on Women Voters by the Numbers (2022) proved it. With the 2024 election in the rearview and critical midterms approaching, we took another look at the power of women at the ballot box.
,
,
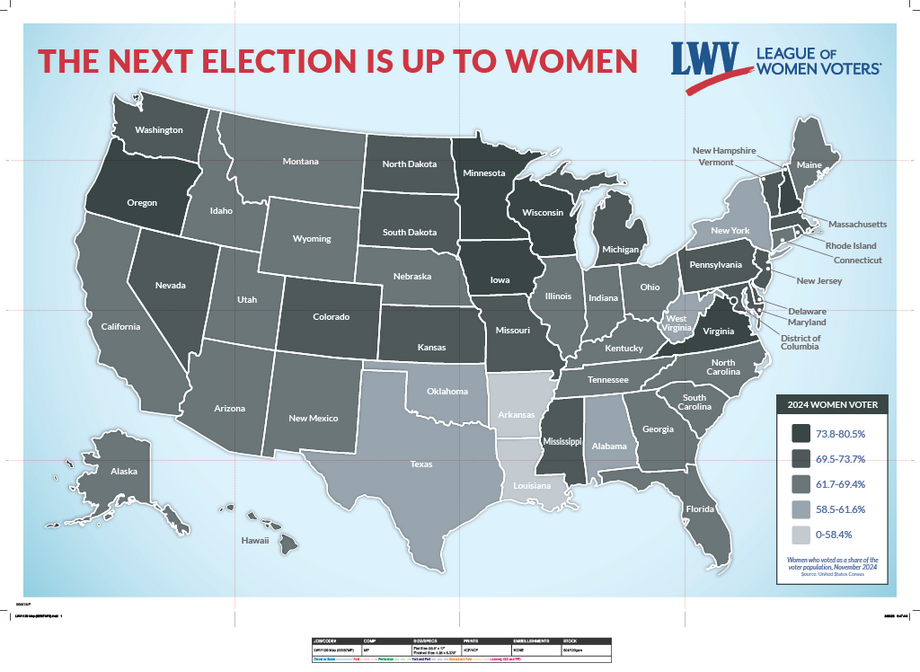
Women Voters in 2024 v. 2022
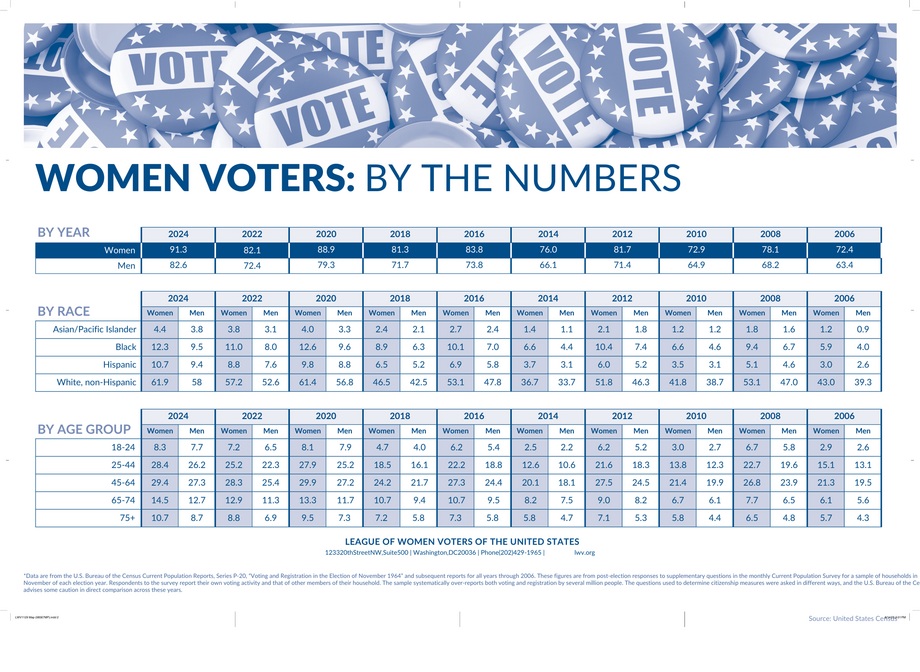
Women turned out in even higher numbers in 2024 than in the 2022 midterms. Notably, in both elections, women turned out in higher numbers than men. In 2024 specifically, 91.3 million women voted, as compared to 82.6 million men.
Rates of female voters were particularly high in Iowa, Minnesota, New Hampshire, Oregon, Wisconsin, and Virginia. Rates were lower, but still significant, in Arkansas and Louisiana.
,
,
Women Voter Demographics
Unsurprisingly, women voters of all ages and (represented) racial identities voted in higher numbers in the presidential election than in the midterm.
Within the represented racial identities (which do not reflect all people, such as those who identify as Middle Eastern and North African), white, non-Hispanic women voted in the highest numbers. Notably, women of color are significantly more likely to be impacted by suppressive anti-voter policies.
Women ages 25-64 cast the most votes, while young voters (aged 18-24) cast the fewest. Engaging young voters remains one of our most important tasks; their voices must be heard as we decide the representatives who will determine their futures.
,
To find a League near you, search our 800+ state and local Leagues.
,
As the report demonstrates, women voters have enormous power in our elections — and the potential to flex it even further as we empower diverse communities.
Get involved engaging the women in your community today! Join your local League or support our work with a donation. Let's power democracy together.