Note: This blog contains data obtained from the US Census that delineates voter trends based on age, race, and gender. While valuable data is shown, not every racial, ethnic, or gender identity is represented.
We pulled data to build a snapshot of how women are voting. It made one thing clear: the next election is up to women.
Map of 2022 Women Voters
We pulled data from the US Census and KFF to illustrate the power of women voters in 2022.
The numbers indicate that women showed up to vote in overwhelming numbers. Notably, this was the year that the Supreme Court overturned the constitutional right to abortion care.
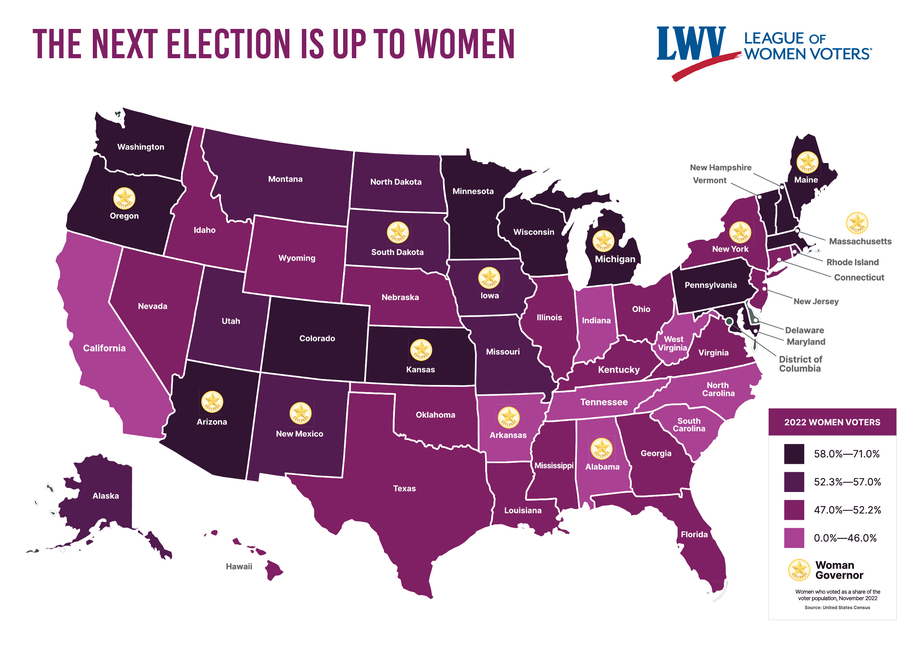
Overall, women voted at higher rates than men. Turnout was particularly high in Arizona, Colorado, the District of Columbia, Kansas, Maine, Maryland, Massachusetts, Michigan, Minnesota, New Hampshire, Oregon, Pennsylvania, Vermont, Washington, and Wisconsin; in these states, women within the voter population voted at rates of roughly 58-71%. Notably, six of the twelve female governors in the US were in these states.
As stated above, in 2022, 12 states elected women governors — a record number. While this is a great accomplishment historically, it hardly reflects a population that's over 50% female.
READ MORE:
https://www.lwv.org/blog/report-women-voters-numbers