Franklin County Divide
Economically Disadvantaged vs. School Rating — Urban/Rural (top left) vs. Suburban (bottom right)
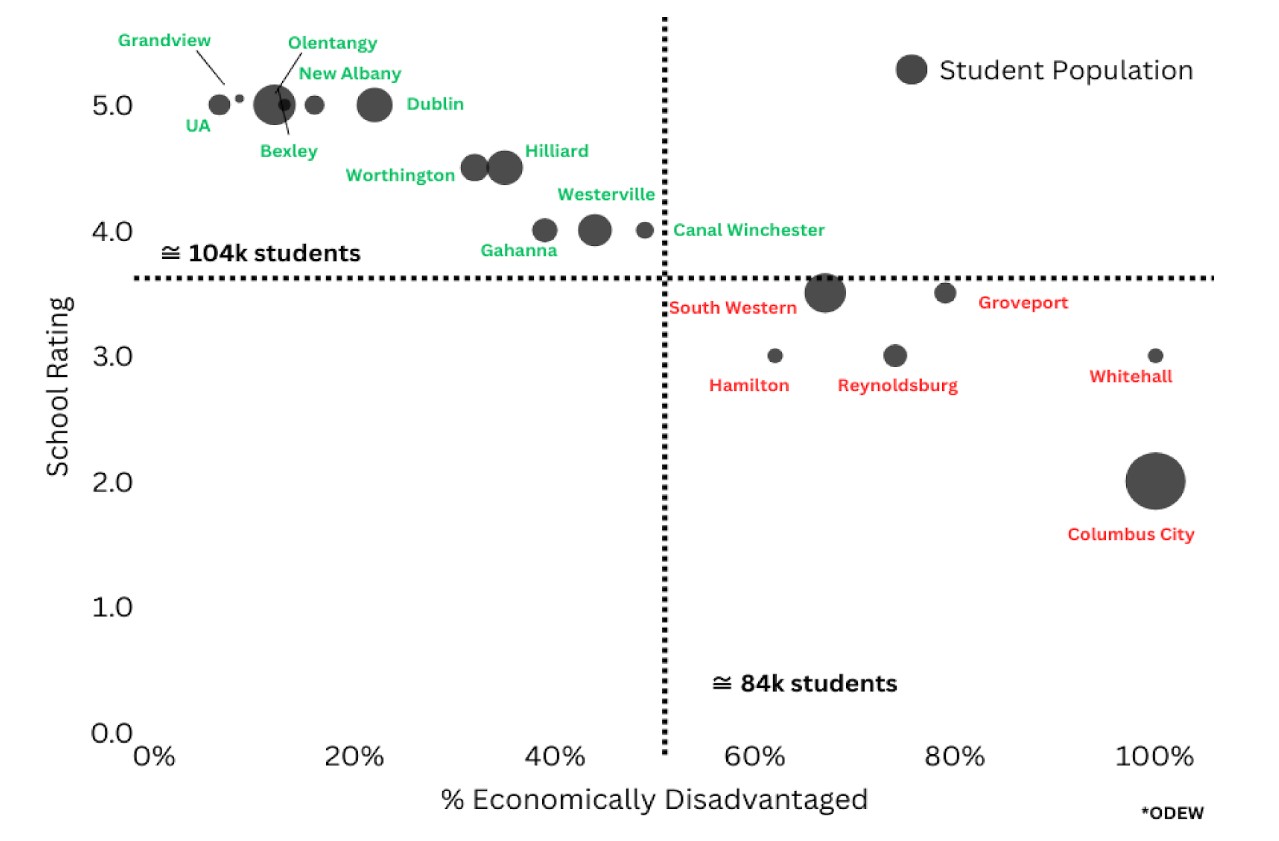
Tip: Open image directly for maximum resolution.
Economic opportunites also limited in UR districts.
Policy: Fair School Funding Plan (FSFP) vs. HB 96 2025, for 2026-2027
▸
FSFP is a non-partisan formula for funding a school district based on the needs of its population. Each district is compelled to make up any shortfall with respect to FSFP by imposing local levies to fill the gap.
| Formula Component | FSFP (Goal) | HB 96 (As Passed) |
|---|---|---|
| Base Cost Inputs | Calculated from current-year teacher salaries, support staff, technology, building operations. | Frozen at FY 2022/23 cost levels → underestimates 2025 actual costs. |
| State Share Percentage (SSP) | Uses district “capacity” (60% property wealth + 40% median income) vs statewide average. | Same formula, but capped phase-in → state pays ~35%, rest pushed to local levies. |
| Economically Disadvantaged Aid | Designed to scale toward ~$6,000 per student, reflecting need intensity. | Flat at $422 per student regardless of concentration of poverty. |
| Special Education Aid | Six weighted categories (Cat 1–6) based on disability services required. | Same categories, but with outdated cost multipliers; underfunds higher-need categories. |
| English Learner Aid | Weighted by proficiency levels; updated annually with state cost studies. | Flat weights based on 2022 data; no cost update for 2025. |
| Career-Technical Ed Aid | Five categories (e.g., trades, health, IT), weighted to reflect program cost. | Same structure, but weights not updated to 2025 program costs. |
| Gifted Education Aid | Funds coordinators, teachers, and student identification services. | Same structure, but frozen funding amounts; no inflation adjustment. |
| Local Levies | State equalization aims to reduce reliance on local levies (esp. poor districts). | Gap left to local levies → ZIP code wealth drives access; 2% in Upper Arlington raises far more than 2% in Columbus. |
| Vouchers / Charters | FSFP not designed to divert funds to private schools. | HB 96 expands EdChoice vouchers without requiring equal testing or accountability; funds diverted from district budgets. |
Note:HB 96 keeps FSFP “on paper” but underfunds it in practice by using outdated inputs, freezing disadvantaged aid, and shifting the burden to local property taxes.
Impact: 26-27 HB 96 (Actual) vs FSFP (Target) Funding for UR—SUB Districts*
▸
| District | Econom. Disadvan. | # Students | HB96 Budget Bill | HB96 Gap wrt FSFP | Performance Supplement | Total HB96 Increase/Shortfall wrt FSFP | Grad % | Grad-based Rating |
|---|---|---|---|---|---|---|---|---|
| Columbus City | 100% | 44,444 | −24,839,768 | −48,387,627 | 0 | −48,387,627 | 79.9 | 1 Star |
| Groveport Madison | 79% | 6,243 | 1,600,894 | −19,520,284 | 649,308 | −18,870,976 | 92.2 | 3 Stars |
| Hamilton | 62% | 3,069 | 1,644,592 | −10,324,106 | 0 | −10,324,106 | 89.2 | 2 Stars |
| Hilliard | 35% | 15,604 | −1,334,490 | −8,690,017 | 2,028,540 | −6,661,477 | 91.5 | 3 Stars |
| South-Western | 67% | 21,174 | −11,513,034 | −78,344,919 | 2,202,120 | −76,142,799 | 90.2 | 3 Stars |
| Whitehall | 100% | 3,312 | 4,712,703 | −21,775,460 | 344,430 | −21,431,030 | 88.3 | 2 Stars |
| 1–3★ Summary | — | 93,846 | −29,729,103 | −187,042,413 | 5,224,398 | −181,818,015 | Per-student shortfall ≈ −$1,937 | |
| District | Economically Disadvantaged | # Students | HB96 Budget Bill | HB96 Gap wrt FSFP | Performance Supplement | Total HB96 Increase/Shortfall to FSFP | Grad % | Grad Rating |
|---|---|---|---|---|---|---|---|---|
| Bexley City | 13% | 2,499 | 274,170 | 167,408 | 324,822 | 492,230 | 97 | 5 Stars |
| Canal Winchester | 49% | 3,615 | −3,384,717 | −12,644,776 | 375,960 | −12,268,816 | 96.9 | 5 Stars |
| Dublin | 22% | 15,934 | 3,517,952 | −6,861,303 | 2,071,421 | −4,789,882 | 96.1 | 4 Stars |
| Gahanna | 39% | 8,011 | −431,246 | −3,902,949 | 833,139 | −3,069,810 | 93.6 | 4 Stars |
| Grandview Heights | 8% | 1,125 | 75,369 | 75,369 | 146,238 | 221,607 | 99.5 | 5 Stars |
| New Albany | 16% | 4,676 | 2,286,404 | −1,745,881 | 607,826 | −1,138,055 | 98.1 | 5 Stars |
| Olentangy Local (Delaware) | 12% | 22,325 | −963,692 | −14,362,309 | 2,929,490 | −11,432,819 | ||
| Reynoldsburg | 74% | 7,081 | 8,022,171 | −27,518,808 | 0 | −27,518,808 | 95.3 | 4 Stars |
| Upper Arlington | 7% | 6,451 | 4,546,991 | −1,160,354 | 838,693 | −321,661 | 98.4 | 5 Stars |
| Westerville | 44% | 13,740 | −2,364,299 | −7,432,022 | 1,428,947 | −6,003,075 | 94 | 4 Stars |
| Worthington | 32% | 10,121 | −2,663,198 | −3,943,340 | 1,184,113 | −2,759,227 | 94.8 | 4 Stars |
| 4–5★ Summary | — | 95,578 | 8,915,905 | −79,328,965 | 10,740,649 | −68,588,316 | Per-student shortfall ≈ −$718 | |
1–3★ Totals
4–5★ Totals
Combined View
*Numbers fromPolicy Matters, accessed 9/22/2025..
Risk Indicators: UR and SUB Dropout Prevention and Recovery (DOPR) Schools 2022–23.
▸
| District | Enrollment | Economically Disadvantaged (%) | Chronically Absent (%) | Suspended ≥1x (%) | Third Grade Literacy (%) | Juvenile Incarceration (per 1,000) | DOPR in District? |
|---|---|---|---|---|---|---|---|
| 1–3 ★ Districts | |||||||
| Columbus City | 45,000 | 75% | 48% | 22% | 38% | 6.0 | Yes |
| South-Western City | 21,000 | 52% | 32% | 14% | 52% | 3.5 | No / Nearby |
| Reynoldsburg City | 10,500 | 51% | 34% | 15% | 47% | 3.8 | No / Nearby |
| Westerville City | 15,000 | 38% | 28% | 11% | 58% | 2.9 | No / Nearby |
| Gahanna-Jefferson | 8,000 | 35% | 22% | 10% | 61% | 2.5 | No |
| Canal Winchester | 4,800 | 37% | 25% | 12% | 55% | 3.0 | No |
| Hamilton Local | 3,500 | 58% | 30% | 14% | 46% | 4.2 | No / Nearby |
| Whitehall City | 3,400 | 74% | 44% | 20% | 40% | 5.5 | Yes |
| Total (2–3 Star) | ~111,000 | ~55% | ~36% | ~15% | ~49% | ≈4.2 | DOPR ≈ 3,000–4,000 countywide |
| 4–5 ★ Districts | |||||||
| Hilliard City | 16,000 | 32% | 20% | 9% | 66% | 1.5 | No |
| Dublin City | 16,500 | 19% | 15% | 6% | 74% | 0.9 | No |
| Worthington City | 10,000 | 27% | 18% | 8% | 68% | 1.2 | No |
| Upper Arlington | 6,000 | 10% | 12% | 5% | 80% | 0.5 | No |
| Bexley City | 2,300 | 12% | 13% | 4% | 78% | 0.6 | No |
| Grandview Heights | 1,100 | 14% | 11% | 4% | 76% | 0.7 | No |
| New Albany–Plain Local | 5,300 | 11% | 13% | 5% | 79% | 0.5 | No |
| Olentangy Local (Franklin share) | 8,000 | 8% | 10% | 3% | 82% | 0.4 | No / Nearby |
| Total (4–5 Star) | ~65,000 | ~17% | ~13% | ~5% | ~75% | ≈0.8 | No DOPR |
| Grand Total | ~176,000 | ~43% | ~28% | ~11% | ~61% | ≈2.5 | DOPR ≈ 3,000–4,000 students countywide |
Footnote:Dropout Prevention and Recovery (DOPR) schoolsare state-chartered public community schools authorized under ORC 3314.35 to serve students aged 16–21 who are credit-deficient, over-age, or previously dropped out. They focus on credit recovery, flexible scheduling, and re-engagement pathways toward high school graduation or equivalency.
Third Grade Literacy (%)= share of students reading proficiently by end of grade 3.
Juvenile Incarceration= estimated rate of youth from that district entering the juvenile justice system annually (per 1,000 students). Rates are approximate, derived from county-level data and district risk profiles.
Diversion: Public Funding for Vouchers (Snapshot 2024)
▸
| Item | 2024 Amount | Share | Key Details |
|---|---|---|---|
| Overall K-12 Funding | |||
| Total K-12 funding (State + Local + Federal) | $26,000,000,000 | 100% | State general fund & lottery + Local (property & income taxes) + Federal grants |
| Local taxpayers | ≈ $13.0B | ~50% | Real estate & local income taxes |
| State taxpayers | ≈ $9.6B | ~37% | State general revenue & lottery funds |
| Federal funds | ≈ $3.4B | ~13% | Title programs, IDEA, nutrition & other grants |
| Voucher Programs (2024) | |||
| Programs | — | — | EdChoice (Traditional), EdChoice Expansion, Autism, Jon Peterson, Cleveland Scholarships |
| EdChoice (Traditional) | ≈ $271,000,000 | — | Available broadly to public?(Yes — see ref) |
| EdChoice Expansion | ≈ $405,000,000 | — | Income-based sliding award; open to general public (no income limit; amount tapers with income) |
| Other vouchers (Autism, Jon Peterson, Cleveland) | ≈ $290,000,000 | — | Specialized eligibility (not general public) |
| EdChoice (Traditional) Details | |||
| Launch & eligibility (2024) | — | — | Launched 2005; targeted to students assigned to low-performing schools; income threshold ≈ 450% FPL (family of 4 ≈ $140,400) |
| Participants (2024) | ≈ 42,500 students | — | Voucher amounts: $6,166 (K-8) and $8,408 (9-12) |
| EdChoice Expansion Details | |||
| Launch & structure | — | — | Initiated 2023; no income cap; voucher value reduced ~linearly from 450%–750% FPL; above 750% FPL: $650 (K-8), $950 (9-12) |
| Participants (2024) | ≈ 88,000 students | — | Private school enrollment rose by ~3,700 → implies most recipients were already in private schools |
| Budget Interaction & Oversight | |||
| Source of voucher dollars | — | — | Paid from the State’s general fund → directly competes with public-school funding (ref) |
| Growth dynamic | — | — | EdChoice Expansion is fastest-growing; projected to consume a rising share of state K-12 funds |
| Accountability & equity | — | — | Private schools accepting vouchers: limited state oversight of curriculum/testing; selective admissions may shift higher-cost needs to public schools (refs needed) |
- Ohio Department of Education & Workforce (ODEW) – School Funding & Report Card portals
- Ohio Legislative Service Commission – Biennial Budget analyses (state GRF/lottery; voucher line items)
- Ohio Dept. of Education – EdChoice & EdChoice Expansion program pages (eligibility, award amounts)
- Autism Scholarship, Jon Peterson Special Needs, and Cleveland Scholarship program pages
- Participation counts & enrollment changes: ODEW data releases (2023–2024)
Notes: Percent shares and dollar figures above reflect your provided 2024 estimates. Replace “refs needed” with specific URLs when finalized.
Research: Foundation Mentoring Type Program Successes
▸
| District | Enrollment | Economically Disadvantaged (%) | Chronically Absent (%) | Suspended ≥1x (%) | Third Grade Literacy (%) | Juvenile Incarceration (per 1,000) | DOPR in District? |
|---|---|---|---|---|---|---|---|
| 1–3 ★ Districts | |||||||
| Columbus City | 45,000 | 75% | 48% | 22% | 38% | 6.0 | Yes |
| South-Western City | 21,000 | 52% | 32% | 14% | 52% | 3.5 | No / Nearby |
| Reynoldsburg City | 10,500 | 51% | 34% | 15% | 47% | 3.8 | No / Nearby |
| Westerville City | 15,000 | 38% | 28% | 11% | 58% | 2.9 | No / Nearby |
| Gahanna-Jefferson | 8,000 | 35% | 22% | 10% | 61% | 2.5 | No |
| Canal Winchester | 4,800 | 37% | 25% | 12% | 55% | 3.0 | No |
| Hamilton Local | 3,500 | 58% | 30% | 14% | 46% | 4.2 | No / Nearby |
| Whitehall City | 3,400 | 74% | 44% | 20% | 40% | 5.5 | Yes |
| Total (2–3 Star) | ~111,000 | ~55% | ~36% | ~15% | ~49% | ≈4.2 | DOPR ≈ 3,000–4,000 countywide |
| 4–5 ★ Districts | |||||||
| Hilliard City | 16,000 | 32% | 20% | 9% | 66% | 1.5 | No |
| Dublin City | 16,500 | 19% | 15% | 6% | 74% | 0.9 | No |
| Worthington City | 10,000 | 27% | 18% | 8% | 68% | 1.2 | No |
| Upper Arlington | 6,000 | 10% | 12% | 5% | 80% | 0.5 | No |
| Bexley City | 2,300 | 12% | 13% | 4% | 78% | 0.6 | No |
| Grandview Heights | 1,100 | 14% | 11% | 4% | 76% | 0.7 | No |
| New Albany–Plain Local | 5,300 | 11% | 13% | 5% | 79% | 0.5 | No |
| Olentangy Local (Franklin share) | 8,000 | 8% | 10% | 3% | 82% | 0.4 | No / Nearby |
| Total (4–5 Star) | ~65,000 | ~17% | ~13% | ~5% | ~75% | ≈0.8 | No DOPR |
| Grand Total | ~176,000 | ~43% | ~28% | ~11% | ~61% | ≈2.5 | DOPR ≈ 3,000–4,000 students countywide |
Footnote:Dropout Prevention and Recovery (DOPR) schoolsare state-chartered public community schools authorized under ORC 3314.35 to serve students aged 16–21 who are credit-deficient, over-age, or previously dropped out. They focus on credit recovery, flexible scheduling, and re-engagement pathways toward high school graduation or equivalency.
Third Grade Literacy (%)= share of students reading proficiently by end of grade 3.
Juvenile Incarceration= estimated rate of youth from that district entering the juvenile justice system annually (per 1,000 students). Rates are approximate, derived from county-level data and district risk profiles.
Education Advocacy: Impact of State Budget HB 96 vs Fair School Funding Plan Targets
Summary
- Basis of analysis:Am. Sub. HB 96, 2025, using data from Legislative Services Commission and Department of Education and Workforce.
- Purpose:Provides the background for LWV Metro Columbus members and allies for advocacy, panels, and testimonials.
- Geographic focus:Metro Columbus (Franklin County School Districts).
- Key framing:The Urban-Rural vs Suburban divide requires us to come together to help more students succeed. One way to do this is with 'Foundation Mentoring'.
- Economic link:Connects improvements in 'Economically Disadvantaged' category of school funding to new economic activity in Franklin County.
- Advocacy strategy:Proposes a strategy for advocacy and legislative action supported by a toolkit.
LWV Background
- State position:LWVO advocates for full funding of public schools via the bipartisan Fair School Funding Plan, covering both instructional and non instructional (categorical) support.
- LWVMC Education Position:The local 2024 study found non-instructional support needs are far greater in urban and rural districts than suburban ones.
- Motivation:Can a physically or mentally traumatized child access learning in the classroom?
- Gap:Programs like SNAP address hunger, but other identified needs in urban and rural populations are also critical for students to access education and these remain unmet.
LWVMC Board adopted (May 2024) the following local position using LWVO education position as a basis:
The data story explained in the document is presented above.