Ohio's Budget Widens the Urban–Rural/Suburban Divide, Foundational Mentoring Pays Dividends
Franklin County Divide: 2–3★ U-R vs 4–5★ SUB Districts
Franklin County — Literacy, Graduation & Investment Summary
Focus: bridging the Urban–Rural (2–3★) and Suburban (4–5★) divide with literacy-first interventions and graduation targets.
What Franklin County Schools Need
| Metric | 2–3★ Urban–Rural UR |
4–5★ Suburban SUB |
Comments / Reference |
|---|---|---|---|
| Total Enrollment | 113,000 | 81,800 | Source:Ohio Report Card |
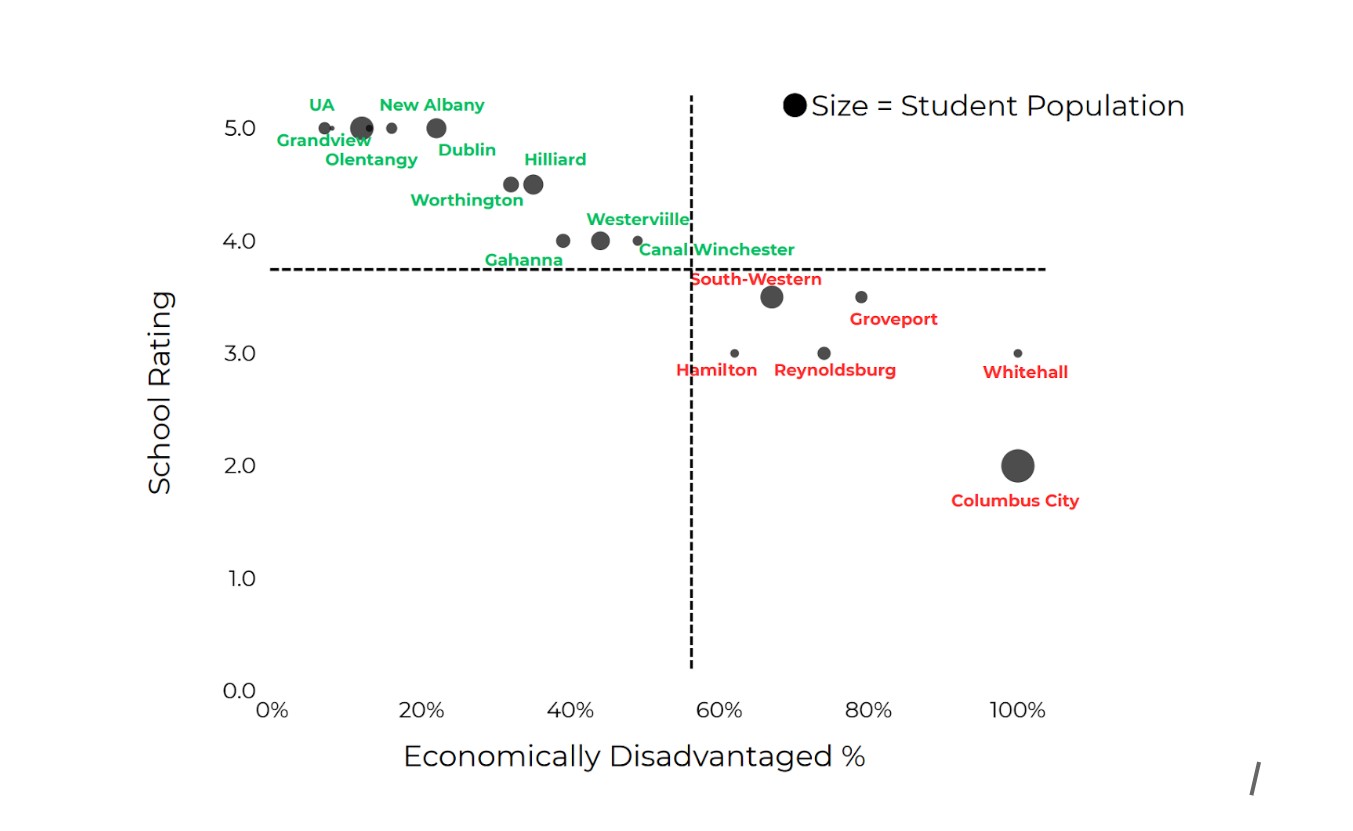
| Avg. Economically Disadvantaged | 68.20% | 19% | Disparity drives service intensity needed in UR. |
| Est. Not Reading at Grade 3(~33% statewide) | 3,240 | 2,348 | Franklin County ≈ 14–15k 3rd graders → ~4.6–5.0k not proficient. Non-proficient readers are ~4× more likely to drop out; dropouts ≈3× more likely to face incarceration/extreme interventions. |
| % At-Risk of Dropout (≈ 4×) | 810 | 587 | Estimate used for planning (actual youth incarcerated ~175 countywide, but dropout risk is a also key indicator). |
| Extreme Intervention Costs (per student ≈ $200k/yr) | $78,000,000 | $2,800,000 | Illustrative burden (drugs, incarceration, etc.); shows scale of reactive costs vs prevention. |
Note:Estimates are directional for advocacy planning and reflect known statewide relationships between early literacy, graduation, and justice involvement.
Graduation Gains & Economic Impact
| Metric | 2–3★ (UR) | 4–5★ (SUB) | Explanation |
|---|---|---|---|
| Current Graduation Rate | ~80% | ~95% | Pattern from ODE report cards (UR lower; SUB already ≈95%). |
| Graduates New (est.) | 90,400 | 77,710 | Enrollment × current grad rate (illustrative). |
| Graduates at 95% Target | 107,350 | 77,710 | Raises UR to 95%; SUB already ~95%. |
| Increase in Graduates | +16,950 | ≈ 0 | Gains are concentrated in 2–3★ districts. |
| Added Annual Economic Value (≈$15,000per additional graduate) | $254,250,000 / yr | $0 | Earnings + taxes + avoided social/corrections costs. |
| County Total (Annual) | ~$254,000,000 | Lifetime (~40 yrs):≈$10.2B | |
Economic increment uses a conservative average of ≈$15,000 per new graduate per year.
26–27 Biennium Funding vs FSFP
| Line Item | 2–3★ (UR) | 4–5★ (SUB) | Comments / Reference |
|---|---|---|---|
| Current Economic Disadvantage Funding | $422 per student | — | Not applicable to community-centered Foundational Mentoring; available to all students. |
| FSFP Shortfall (Total) | −$229,850,951 | −$22,400,895 | Assumes state fully funds districts; remaining burden shifts local. |
| FSFP Shortfall (Per Student) | ≈ $2,034 | ≈ $274 | Per-student shortfall = total shortfall ÷ district students. |
| Share Covered by State vs Levies | State ≈ 35%; Levies ≈ 65% | State ≈ 35%; Levies ≈ 65% | What can be raised varies by property values (2% in UA ≫ 2% in Columbus). |
| FSFP Shortfall Not Made Up by Levies | ? | ? | To fill in:county auditor + district levy receipts (2024). See: Franklin County Auditor & ODE District Profiles. |
Source links:Ohio Report Card, Franklin County Auditor (levy receipts), ODE District Profiles.
Foundation Mentoring — Investment Snapshot
Investment Need
- UR (2–3★) non-readers × $6,000 →$19.44M
- SUB (4–5★) non-readers × $6,000 →$14.088M
- Total:$33.528M
Why It Pays
- 3rd-grade literacy → 4× higher grad odds.
- New graduates add ≈$15,000/yr each in value.
- Reduces extreme interventions (≈$200k/youth/year).
- Increases economic activity by (≈$254,250,000per year; ≈$10.2Bover 40 yrs)
Advocacy Takeaways
The Ask
- preventive mentoring for all identified students.
- proactive mentoring identified by at-risk data.
- resource coordinator at each building to work within the community.
The goal is to provide students with mentoring that, in addition to the state's services, ensures follow through by connecting to the families and community.
Justification
- Funding gap is inequitable:2–3★ UR districts bear ~91% of the combined FSFP shortfall (−$229.9M of −$252.3M), ≈$1,760more shortfall per student than suburban peers (UR ≈$2,034vs SUB ≈$274).
- Limited local tax capacity magnifies the gap:FSFP shortfall per student is substantially higher in UR (≈$2,034) than SUB (≈$274), and levy capacity varies is less in UR districts.
- Higher UR student needs with lower in-school capacity:UR districts average68.2%economically disadvantaged students vs19%in suburban districts.
- Policy ask:Prevent diversion of public funds with vouchers for the wealthy and require standards for all publicly funded schools. This will help close the divide.
- Foundational Mentoring pays:Preventive investment (~$6,000/student) helps avoid extreme interventions (~$200,000/youth/year).
- Economic upside:Raising 2–3★ districts to 95% graduation adds ≈$254,250,000 per yearin countywide value (≈$10.2Bover 40 years).
- 📌 Franklin County pilot:Propose a countywide pilot program to establish clear metrics on Foundation Mentoring and graduation outcomes. This pilot would document avoided costs, track literacy and mentoring impacts, and provide evidence for scaling statewide investments.
Sources & Notes:Numbers are fromMetro Columbus Public Education Advocacyand the Ohio Report Card. Literacy→cost avoidance assumptions held constant across groups for comparability.
Sources
- Ohio Report Card — Enrollment & Performance
- Franklin County Auditor — Levy collections & rates (district receipts)
- ODE District Profiles (Cupp Reports) — Local revenue & funding mix
- Research on literacy → graduation → incarceration; Ohio youth cost ≈ $200k/youth/year (ODYS / Policy Matters)
- Metro Columbus Public Education Advocacy
Advocate: Inform with Trusted Information
|
Work for Democracy: Volunteer for Voter Outreach Actions
|
Be a Member: Learn How We Fight For Democracy
|
Honor Civic Contributions: Democracy In Action
|


Calendar
SignUp for Events
Please use the eVoter emails to access current information and signUp!
Franklin County Divide
Economically Disadvantaged vs. School Rating illustrating the Urban-Rural (top left) / Suburban (bottom right) divide
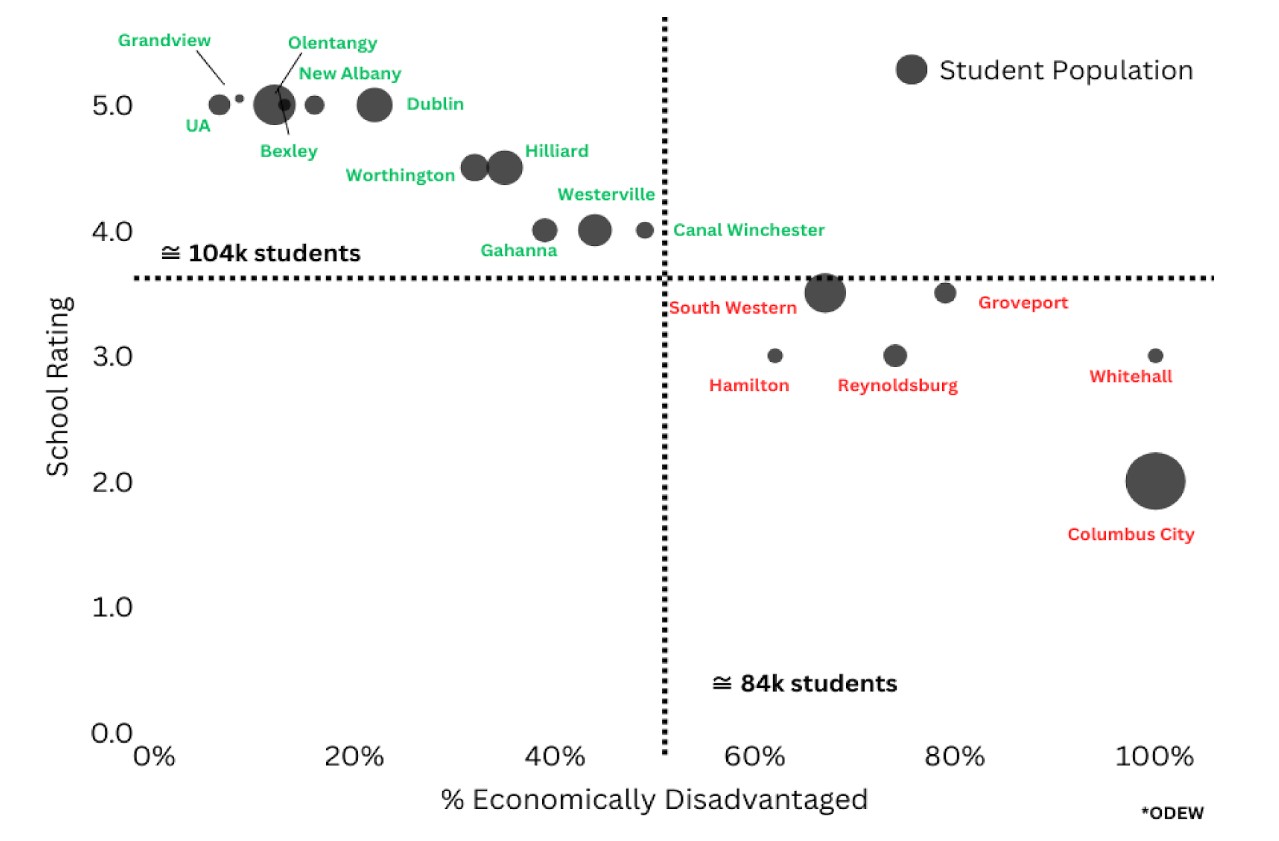
Tip: Open image directly for maximum resolution.