Advocacy Summary: 2026-2027 Bienniem HB 96 and Fair School Funding Plan
Summary
- Basis of analysis:Am. Sub. HB 96, 2025, using data from Legislative Services Commission and Department of Education and Workforce.
- Purpose:Provides background for LWV Metro Columbus members and allies for advocacy, panels, and testimonials.
- Geographic focus:Metro Columbus (Franklin County).
- Key framing:Highlights the urban rural suburban divide and requirements to help more students succeed.
- Economic link:Connects improvements in education funding to new economic activity in Franklin County.
- Advocacy strategy:Proposes a toolkit strategy for advocacy and legislative action.
LWV Background
- State position:LWVO advocates for full funding of public schools via the bipartisan Fair School Funding Plan, covering both instructional and non instructional (categorical) support.
- Local study:The 2024 LWVMC Education Position study found non instructional support needs are far greater in urban and rural districts than suburban ones.
LWVMC Board adopted the following local position using LWVO education position as a basis:
- Motivation:Can a physically or mentally traumatized child access learning in the classroom?
- Gap:Programs like SNAP address hunger, but other needs in urban and rural populations that arecritical for students to access educationremain unmet.
Tables below provide the data story referred to in the document above.
Franklin County Divide
Economically Disadvantaged vs. Performance Rating
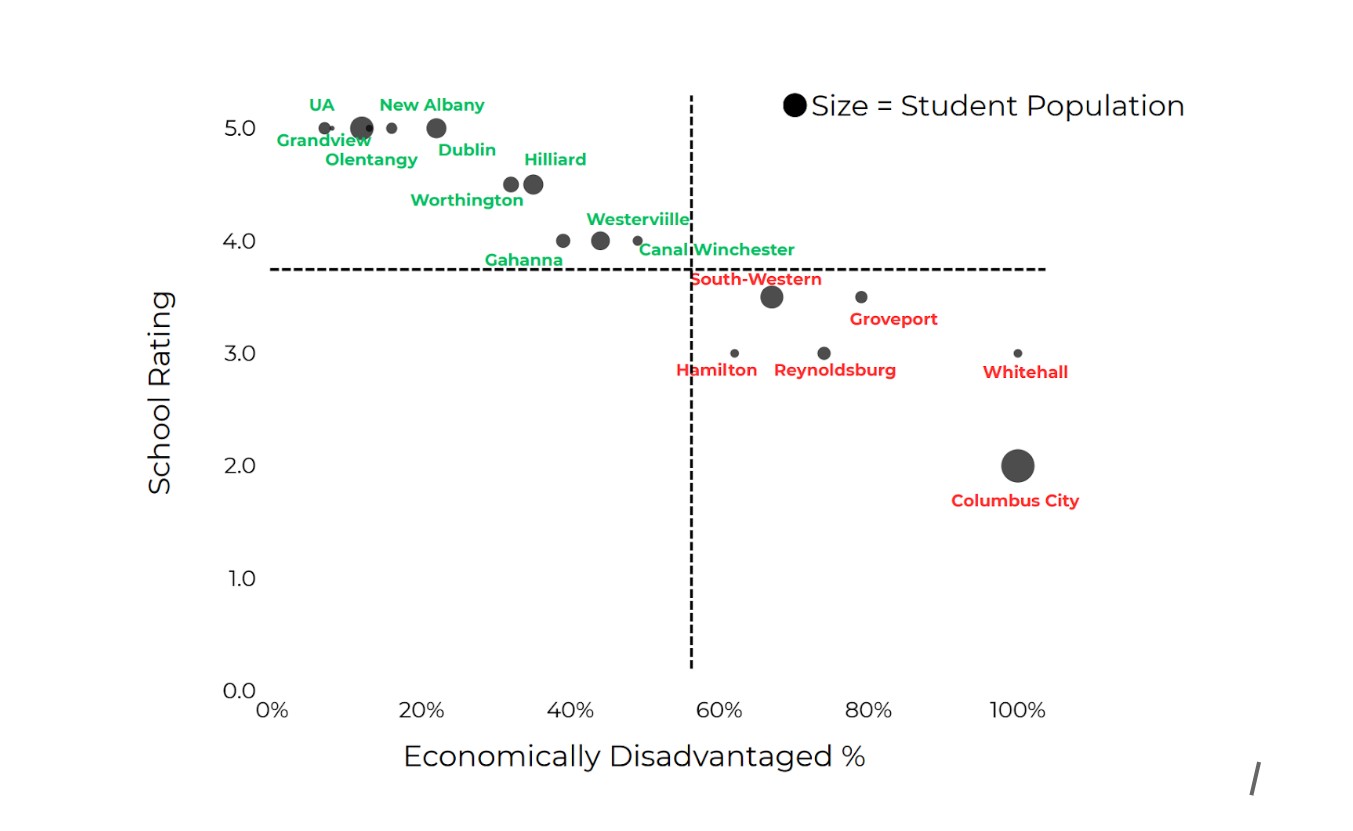
Tip: Click “Open full size” for maximum resolution.
How automation can deepen poverty across rural, urban communities
Automation → Pathways to Poverty → Why/How Policy Can Flip the Script
• Autor, Levy, & Murnane (2003).The Skill Content of Recent Technological Change. QJE.
• Autor (2014).Skills, Education, and the Rise of Earnings Inequality. Science.
• Acemoglu & Restrepo (2020).Robots and Jobs. JPE.
• National Skills Coalition (2020).Digital Literacy.
• De Stefano (2016).Just-in-Time Workforce. CLLPJ.
• Piketty (2014).Capital in the 21st Century.
Recent (2024–2025) journalism & science:
•NYT (2025). “Robots Are Coming for More Jobs. The Safety Net Isn’t Ready.”
•NYT (2025). “AI Is Reshaping the Middle Class.”
•The Atlantic (2025). “The Automation Trap.”
•The Atlantic (2024). “The New Geography of Work.”
•Time (2025). “Will AI Kill Your Job or Make It Better?”
•Time (2024). “The Next Labor Divide.”
•Science (2025). “Automation, AI, and Inequality: A Tipping Point?”
•Science (2024). “Workforce Polarization Revisited in the Age of Generative AI.”
•Fair School Funding Plan (FSFP):equalize K–12 resources across 2–3★ and 4–5★ districts.
•TechCred & Sector Partnerships:fast reskilling for displaced rural/urban workers in manufacturing, logistics, health care, IT.
•ODJFS + ODE alignment:connect adult ed, community colleges, and employers; remove childcare/transport barriers.
•Portable benefits & wage supports:EITC, childcare subsidies, and health coverage that follow the worker.
•Fair algorithmic management:scheduling transparency, data rights, and basic protections for gig/platform workers.
•Share the gains:ensure automation productivity helps fund education/workforce pipelines locally.
Metro Columbus — LWV Summary of 2–3★ vs 4–5★ Districts
2–3★ Urban–RuralUR
4–5★ SuburbanSUB
Advocacy Takeaways
- Funding gap is inequitable:2–3★ UR districts bear ~91% of the combined Fair School Funding Plan (FSFP) shortfall (−$229.9M of −$252.3M), ≈$1,760more shortfall per student than suburban peers.
- Higher needs left with lower capacity:UR districts average68.2%economically disadvantaged students vs19%in suburban districts.
- The 'Economically disadvantaged' component is currently funded by the state at $422 per student. Best practices suggest $6000 per identified student and a Resource Coordinator for each building.
- Request your legislators to address the gap for 2–3★ UR districts by preventing diversion of public funds with vouchers for the wealthy and requiring standards for all publically-funded schools.
- Prevention pays:With consistent assumptions, annual incarceration costs avoided are materially larger than annual early-intervention costs in both groups, indicating strong ROI for prevention and literacy support.
- Economic upside:Raising 2–3★ districts to 95% graduation adds an estimated$33.6Min annual earnings, on top of current activity.
Sources & Notes:Numbers are from Metro Columbus Public Education Advocacy. Literacy→incarceration assumptions held constant across groups for comparisons.
From Students to Skilled Workers: Increasing Economic Activity
Public Education Advocacy Strategy
Quantifying the Urban–Rural / Suburban Divide, Funding Gap and Impact
| District | Enrollment | Performance | Areas | Economically disadvantaged % | Impact on schools | FSFP shortfall 26–27 |
|---|---|---|---|---|---|---|
| 2–3 ★ Urban–Rural (UR) Districts | ||||||
| Columbus City | 45,000 | 2★ | Columbus core | 100% | High poverty; state cuts hit hardest | -48,387,627 |
| Canal Winchester Local | 4,300 | 3★ | SE Franklin & Fairfield | 49% | High reliance on state funding; staffing risk | -12,644,776 |
| Gahanna-Jefferson | 7,900 | 3★ | Gahanna | 39% | Cuts hurt literacy programs | -3,902,949 |
| Groveport Madison | 6,300 | 2★ | SE Franklin | 79% | High poverty; severe cuts impact | -19,520,284 |
| Hamilton Local | 3,200 | 3★ | Hamilton Twp, Obetz | 62% | Higher poverty; state aid dependent | -10,324,106 |
| Reynoldsburg City | 7,500 | 3★ | East Columbus / Licking | 74% | Loss of aid threatens STEM programs | -27,518,808 |
| South-Western City | 21,000 | 3★ | SW Franklin | 67% | Weaker tax base; aid reliance | -78,344,919 |
| Westerville City | 14,500 | 3★ | Westerville | 44% | Loss of funding slows recovery | -7,432,022 |
| Whitehall City | 3,300 | 2★ | Whitehall | 100% | High mobility; low proficiency | -21,775,460 |
| UR cumulative | 113,000 | 2–3★ | — | avg. 68.2% | — | -229,850,951 |
| District | Enrollment | Performance | Areas | Economically disadvantaged % | Impact on schools | FSFP shortfall 26–27 |
|---|---|---|---|---|---|---|
| 4–5 ★ Suburban (S) Districts | ||||||
| Bexley City | 2,300 | 5★ | Bexley | 13% | Minimal direct impact | — |
| Dublin City | 16,800 | 5★ | Dublin | 22% | Cuts hit targeted programs | -6,861,303 |
| Grandview Heights | 1,000 | 5★ | Grandview Heights | 8% | Affluent; state cuts affect specialized programs | 0 |
| Hilliard City | 16,400 | 4★ | Hilliard | 35% | Cuts widen subgroup gaps | -8,690,017 |
| New Albany–Plain Local | 5,300 | 5★ | New Albany / Plain Twp | 16% | Affluent; targeted programs affected by cuts | -1,745,881 |
| Olentangy Local* | 23,000 | 5★ | NW Franklin (part) | Funding limits growth capacity | — | |
| Upper Arlington City | 6,200 | 5★ | Upper Arlington | 7% | Minimal direct impact; enrichment focus | -1,160,354 |
| Worthington City | 10,800 | 4★ | Worthington | 32% | Loss of aid slows progress | -3,943,340 |
| Suburban cumulative | 81,800 | 4–5★ | — | avg:19%/strong> | — | -22,400,895 |
Comparison of UR/S Districts
UR (2–3★) — Totals
Suburban (4–5★) — Totals
Per-Student Shortfall
Share of Total Shortfall
Performance Bands
Performance Bands
Literacy Gaps and Estimated Cost Avoidance (Trauma, Incarceration Costs)
Summary ComparisonUR vs Suburban
| Group | Enrollment | Est. # Not Reading | Incarcerations Avoided | Annual Costs Avoided | Per-Student Cost Avoided |
|---|---|---|---|---|---|
| 2–3★ Urban–Rural | 113,000 | 34,641 | 346 | $69,200,000 | $612 |
| 4–5★ Suburban | 81,800 | 7,924 | 80 | $16,000,000 | $196 |
2–3 Star Districts
| District | Enrollment | % Not Reading | Est. # Not Reading | Incarcerations Avoided | Annual Costs Avoided |
|---|---|---|---|---|---|
| Columbus City | 45,000 | 33% | 14,850 | 148 | $29,600,000 |
| Groveport Madison | 6,300 | 35% | 2,205 | 22 | $4,400,000 |
| Whitehall City | 3,300 | 38% | 1,254 | 13 | $2,600,000 |
| South-Western City | 21,000 | 32% | 6,720 | 67 | $13,400,000 |
| Westerville City | 14,500 | 23% | 3,335 | 33 | $6,600,000 |
| Gahanna-Jefferson | 7,900 | 24% | 1,896 | 19 | $3,800,000 |
| Canal Winchester | 4,300 | 28% | 1,204 | 12 | $2,400,000 |
| Reynoldsburg City | 7,500 | 27% | 2,025 | 20 | $4,000,000 |
| Hamilton Local | 3,200 | 36% | 1,152 | 12 | $2,400,000 |
| Total — 2–3★ | 113,000 | 34,641 | 346 | $69,200,000 |
4–5 Star Districts
| District | Enrollment | % Not Reading | Est. # Not Reading | Incarcerations Avoided | Annual Costs Avoided |
|---|---|---|---|---|---|
| Hilliard City | 16,400 | 18% | 2,952 | 30 | $6,000,000 |
| Worthington City | 10,800 | 14% | 1,512 | 15 | $3,000,000 |
| Bexley City | 2,300 | 9% | 207 | 2 | $400,000 |
| Dublin City | 16,800 | 8% | 1,344 | 13 | $2,600,000 |
| Upper Arlington | 6,200 | 7% | 434 | 4 | $800,000 |
| Olentangy Local* | 23,000 | 5% | 1,150 | 12 | $2,400,000 |
| Grandview Heights | 1,000 | 6% | 60 | 1 | $200,000 |
| New Albany–Plain | 5,300 | 5% | 265 | 3 | $600,000 |
| Total — 4–5★ | 81,800 | 7,924 | 80 | $16,000,000 |
Urban-Rural/Suburban Divide, Funding Gap and Impact
| District | Enrollment | Performance | Areas | Economic. disadvantaged % | Impact on schools | FSFP shortfall 26-27 |
|---|---|---|---|---|---|---|
| Urban–Rural Districts | ||||||
| Columbus City | 45,000 | ⭐⭐ | Columbus core | 100% | High poverty; state cuts hit hardest | -48,387,627 |
| Canal Winchester Local | 4,300 | ⭐⭐⭐ | SE Franklin & Fairfield | 49% | High reliance on state funding; staffing risk | -12,644,776 |
| Gahanna-Jefferson | 7,900 | ⭐⭐⭐ | Gahanna | 39% | Cuts hurt literacy programs | -3,902,949 |
| Groveport Madison | 6,300 | ⭐⭐ | SE Franklin | 79% | High poverty; severe cuts impact | -19,520,284 |
| Hamilton Local | 3,200 | ⭐⭐⭐ | Hamilton Twp, Obetz | 62% | Higher poverty; state aid dependent | -10,324,106 |
| Reynoldsburg City | 7,500 | ⭐⭐⭐ | East Columbus / Licking | 74% | Loss of aid threatens STEM programs | -27,518,808 |
| South-Western City | 21,000 | ⭐⭐⭐ | SW Franklin | 67% | Weaker tax base; aid reliance | -78,344,919 |
| Westerville City | 14,500 | ⭐⭐⭐ | Westerville | 44% | Loss of funding slows recovery | -7,432,022 |
| Whitehall City | 3,300 | ⭐⭐ | Whitehall | 100% | High mobility; low proficiency | -21,775,460 |
| 2 & 3 ⭐ urban–rural:(av. economically disadvantaged: 68.2%) | 113,000 | — | — | — | — | -229,850,951 |
| District | Enrollment | Performance | Areas | Economic. disadvantaged % | Impact on schools | FSFP shortfall 26-27 |
|---|---|---|---|---|---|---|
| Suburban Districts | ||||||
| Bexley City | 2,300 | ⭐⭐⭐⭐⭐ | Bexley | 13% | Minimal direct impact | — |
| Dublin City | 16,800 | ⭐⭐⭐⭐⭐ | Dublin | 22% | Cuts hit targeted programs | -6,861,303 |
| Grandview Heights | 1,000 | ⭐⭐⭐⭐⭐ | Grandview Heights | 8% | Affluent; state cuts affect specialized programs | 0 |
| Hilliard City | 16,400 | ⭐⭐⭐⭐ | Hilliard | 35% | Cuts widen subgroup gaps | -8,690,017 |
| New Albany–Plain Local | 5,300 | ⭐⭐⭐⭐⭐ | New Albany / Plain Twp | 16% | Affluent; targeted programs affected by cuts | -1,745,881 |
| Olentangy Local* | 23,000 | ⭐⭐⭐⭐⭐ | NW Franklin (part) | Funding limits growth capacity | — | |
| Upper Arlington City | 6,200 | ⭐⭐⭐⭐⭐ | Upper Arlington | 7% | Minimal direct impact; enrichment focus | -1,160,354 |
| Worthington City | 10,800 | ⭐⭐⭐⭐ | Worthington | 32% | Loss of aid slows progress | -3,943,340 |
| 4–5 ⭐ suburban:(av. economically disadvantaged: 19%) | 81,800 | — | — | — | — | -22,400,895 |
undefinedundefined
Funding Early Intervention Covered by Incarceration Avoidance?
| District | Enroll | Perf | Total Early Intervention Cost (annual) |
Incarceration Avoidance (annual) |
|---|---|---|---|---|
| Columbus City | 45,000 | ⭐⭐ | $360,000,000 | $9,000,000,000 |
| Groveport Madison | 6,300 | ⭐⭐ | $50,400,000 | $1,260,000,000 |
| Whitehall City | 3,300 | ⭐⭐ | $26,400,000 | $660,000,000 |
| South-Western City | 21,000 | ⭐⭐⭐ | $168,000,000 | $4,200,000,000 |
| Westerville City | 14,500 | ⭐⭐⭐ | $116,000,000 | $2,900,000,000 |
| Gahanna-Jefferson | 7,900 | ⭐⭐⭐ | $63,200,000 | $1,580,000,000 |
| Canal Winchester Local | 4,300 | ⭐⭐⭐ | $34,400,000 | $860,000,000 |
| Reynoldsburg City | 7,500 | ⭐⭐⭐ | $60,000,000 | $1,500,000,000 |
| Hamilton Local | 3,200 | ⭐⭐⭐ | $25,600,000 | $640,000,000 |
| Total – 2 & 3 Star Districts (113,000 students) | $904,000,000 | $22,600,000,000 | ||
| Hilliard City | 16,400 | ⭐⭐⭐⭐ | $131,200,000 | $3,280,000,000 |
| Worthington City | 10,800 | ⭐⭐⭐⭐ | $86,400,000 | $2,160,000,000 |
| Bexley City | 2,300 | ⭐⭐⭐⭐⭐ | $18,400,000 | $460,000,000 |
| Dublin City | 16,800 | ⭐⭐⭐⭐⭐ | $134,400,000 | $3,360,000,000 |
| Upper Arlington City | 6,200 | ⭐⭐⭐⭐⭐ | $49,600,000 | $1,240,000,000 |
| Olentangy Local* | 23,000 | ⭐⭐⭐⭐⭐ | $184,000,000 | $4,600,000,000 |
| Grandview Heights | 1,000 | ⭐⭐⭐⭐⭐ | $8,000,000 | $200,000,000 |
| New Albany–Plain Local | 5,300 | ⭐⭐⭐⭐⭐ | $42,400,000 | $1,060,000,000 |
| Total – 4 & 5 Star Districts (81,800 students) | $654,400,000 | $16,360,000,000 | ||
*Olentangy Local enrollment reflects portion in Franklin County.
Notes:For comparability, per-student assumptions are held constant across districts and moved from the table to this footnote: Early Intervention ≈$8,000 per student/year; Youth Incarceration ≈$200,000 per youth/year; Implied per-student savings ≈$192,000(incarceration minus intervention). Sources include Ohio Early Intervention program guidance and ODYS/related state-local cost estimates.
Economic Activity of High School Graduates by Increasing Graduation Rates
| District | Enrolled | Graduation Rate (%) |
Annual Graduates |
Median Annual Earnings per Grad |
Total Annual Earnings |
Remaining Potential (@ 95% Grad. rate) |
|---|---|---|---|---|---|---|
| 2–3 Star Districts | ||||||
| Columbus City | 45,000 | 80 | 3,600 | $28,000 | $100,800,000 | $18,900,000 |
| Groveport Madison | 6,300 | 85 | 535 | $30,000 | $16,050,000 | $1,888,235 |
| Whitehall City | 3,300 | 78 | 257 | $28,000 | $7,196,000 | $1,568,359 |
| South-Western City | 21,000 | 87 | 1,827 | $31,000 | $56,637,000 | $5,208,000 |
| Westerville City | 14,500 | 92 | 1,334 | $35,000 | $46,690,000 | $1,522,500 |
| Gahanna-Jefferson | 7,900 | 91 | 719 | $34,000 | $24,446,000 | $1,074,549 |
| Canal Winchester Local | 4,300 | 90 | 387 | $33,000 | $12,771,000 | $709,500 |
| Reynoldsburg City | 7,500 | 88 | 660 | $32,000 | $21,120,000 | $1,680,000 |
| Hamilton Local | 3,200 | 84 | 269 | $31,000 | $8,339,000 | $1,092,012 |
| Total 2–3 Star Districts | $294,049,000 | $33,643,155 | ||||
| District | Enrolled | Graduation Rate (%) |
Annual Graduates |
Median Annual Earnings per Grad |
Total Annual Earnings |
Remaining Potential (@ 95% Grad. rate) |
|---|---|---|---|---|---|---|
| 4–5 Star Districts | ||||||
| Hilliard City | 16,400 | 95 | 1,558 | $38,000 | $59,204,000 | $0 |
| Worthington City | 10,800 | 96 | 1,037 | $39,000 | $40,443,000 | $0 |
| Bexley City | 2,300 | 98 | 225 | $40,000 | $9,000,000 | $0 |
| Dublin City | 16,800 | 97 | 1,629 | $41,000 | $66,789,000 | $0 |
| Upper Arlington City | 6,200 | 98 | 608 | $42,000 | $25,536,000 | $0 |
| Olentangy Local* | 23,000 | 97 | 2,231 | $41,000 | $91,471,000 | $0 |
| Grandview Heights | 1,000 | 96 | 92 | $40,000 | $3,680,000 | $0 |
| New Albany–Plain Local | 5,300 | 97 | 498 | $42,000 | $20,916,000 | $0 |
| Total 4–5 Star Districts | $317,039,000 | $0 | ||||
*Olentangy Local enrollment reflects portion within Franklin County. “Remaining Potential” estimates the additional annual earnings if each 2–3★ district reached a 95% graduation rate, using the same median earnings per graduate shown.
Ohio K-12 Funding & Voucher Snapshot (2024)
| Item | 2024 Amount | Share | Key Details |
|---|---|---|---|
| Overall K-12 Funding | |||
| Total K-12 funding (State + Local + Federal) | $26,000,000,000 | 100% | State general fund & lottery + Local (property & income taxes) + Federal grants |
| Local taxpayers | ≈ $13.0B | ~50% | Real estate & local income taxes |
| State taxpayers | ≈ $9.6B | ~37% | State general revenue & lottery funds |
| Federal funds | ≈ $3.4B | ~13% | Title programs, IDEA, nutrition & other grants |
| Voucher Programs (2024) | |||
| Programs | — | — | EdChoice (Traditional), EdChoice Expansion, Autism, Jon Peterson, Cleveland Scholarships |
| EdChoice (Traditional) | ≈ $271,000,000 | — | Available broadly to public?(Yes — see ref) |
| EdChoice Expansion | ≈ $405,000,000 | — | Income-based sliding award; open to general public (no income limit; amount tapers with income) |
| Other vouchers (Autism, Jon Peterson, Cleveland) | ≈ $290,000,000 | — | Specialized eligibility (not general public) |
| EdChoice (Traditional) Details | |||
| Launch & eligibility (2024) | — | — | Launched 2005; targeted to students assigned to low-performing schools; income threshold ≈ 450% FPL (family of 4 ≈ $140,400) |
| Participants (2024) | ≈ 42,500 students | — | Voucher amounts: $6,166 (K-8) and $8,408 (9-12) |
| EdChoice Expansion Details | |||
| Launch & structure | — | — | Initiated 2023; no income cap; voucher value reduced ~linearly from 450%–750% FPL; above 750% FPL: $650 (K-8), $950 (9-12) |
| Participants (2024) | ≈ 88,000 students | — | Private school enrollment rose by ~3,700 → implies most recipients were already in private schools |
| Budget Interaction & Oversight | |||
| Source of voucher dollars | — | — | Paid from the State’s general fund → directly competes with public-school funding (ref) |
| Growth dynamic | — | — | EdChoice Expansion is fastest-growing; projected to consume a rising share of state K-12 funds |
| Accountability & equity | — | — | Private schools accepting vouchers: limited state oversight of curriculum/testing; selective admissions may shift higher-cost needs to public schools (refs needed) |
- Ohio Department of Education & Workforce (ODEW) – School Funding & Report Card portals
- Ohio Legislative Service Commission – Biennial Budget analyses (state GRF/lottery; voucher line items)
- Ohio Dept. of Education – EdChoice & EdChoice Expansion program pages (eligibility, award amounts)
- Autism Scholarship, Jon Peterson Special Needs, and Cleveland Scholarship program pages
- Participation counts & enrollment changes: ODEW data releases (2023–2024)
Notes: Percent shares and dollar figures above reflect your provided 2024 estimates. Replace “refs needed” with specific URLs when finalized.
Legislative Watchlist
- ▸Budget pressures: balancing shrinking state revenues with public school needs
- ▸School funding formula: use of 2023 costs, inflation gap, and adequacy of targeted non-instructional supports
- ▸Tax policy: income tax phase-down, levy reliance, and property tax abatements
- ▸Inequality: demographic shifts (gentrification) and strain on local districts
- ▸Vouchers & choice: EdChoice/Expansion growth; <20% low-income beneficiaries; public system impact
- ▸Curriculum & standards: state involvement across all publicly funded schools
- ▸Free speech in schools: balancing protections and rights
- ▸Safety: school security and student well-being initiatives
- ▸Fair districting: effective representation in the General Assembly
- ▸Federal-to-state matching: risk of shrinking categorical aid (migrant, ESL, homeless)
- ▸Federal funding: Cuts to Medicaid for student mental and physical well being
- ▸FSFP funding gap: ~$2.5B needed to meet actual costs and categorical supports
- ▸Hidden tax shift: underfunding pushes costs to levies, rents, and sales taxes (regressive)
- ▸Voucher targeting: expansion primarily benefits higher-income families; public funds diverted
- ▸Accountability parity: require comparable standards so private voucher schools can be evaluated vs. public schools
- ▸Flat tax effects: reduced progressivity lowers state revenue, increasing local tax burdens
- ▸Carryover cap: 20% limit; excess (~$4B statewide) swept to state, reducing local flexibility
- ▸Open enrollment practice: capacity/loophole policies limit interdistrict access from high-poverty areas
- ▸Governance shift: Am.Sub. HB 96 increases gubernatorial control over the State Board (11 elected / 8 appointed)
- ▸Public spending trade-offs: $600M stadium subsidy vs. underfunded schools in urban-rural areas
- ▸Federal volatility: potential Title I/IDEA/nutrition reductions; ESSER expiration pressures local budgets
- ▸Transportation mandates: district costs for charter/private transport or reimbursement within legal limits
- ▸Demonstration grants: HB 96 pilots ($15M FY26; $35M FY27) for community-based models
- ▸Property tax relief: rollbacks/homestead ($1.30B FY26; $1.33B FY27) amid continued levy pressure
- ▸Literacy support: $12M/yr lottery profits for literacy coaches
- ▸Facilities aid: community school facilities increases from lottery profits (FY26/FY27)