
August 17, 2021
Redistricting: Math and Maps
Introduction
In Blogs 1, 2 and 3, I focused on the “why” and “how” of Redistricting.
- We know that districts are geographic, often described as “representational” areas defined by federal and state law.
- They must be of substantially equal size as measured by population of residents.
- We also know about the Redistricting process used in CT and which institutions are invested with the authority to create district maps.
- Blog 3 featured criteria other than population equality and highlighted gerrymandering, a tactic used to favor a political party.
In Blog 4, I will focus on maps. I will…
- introduce a mapping application,
- review the output available therein and
- consider how these results may foreshadow needed map adjustments resulting from population changes identified by the 2020 Census and by policy changes in CT.
Joan Twiggs
______________________________________________________________
 Note to Readers: This blog was drafted before the release of Census data on August 12, 2021. Dave's Redistricting App 2020 (DRA2020 - the mapping application) has now been updated to use Census 2020 data. When readers examine statistics now showing in DRA2020 they will be based on Census data and not the American Community Servey (ACS) data used at the time of this writing.
Type of Districts in Connecticut
Let’s take a look at the districts in our state of Connecticut. As we know, Connecticut has 5 Congressional Districts, 36 State Senate Districts and 151 State House Districts. What do we know about our maps when it comes to various map criteria? Where can we turn for help in understanding the Connecticut story?
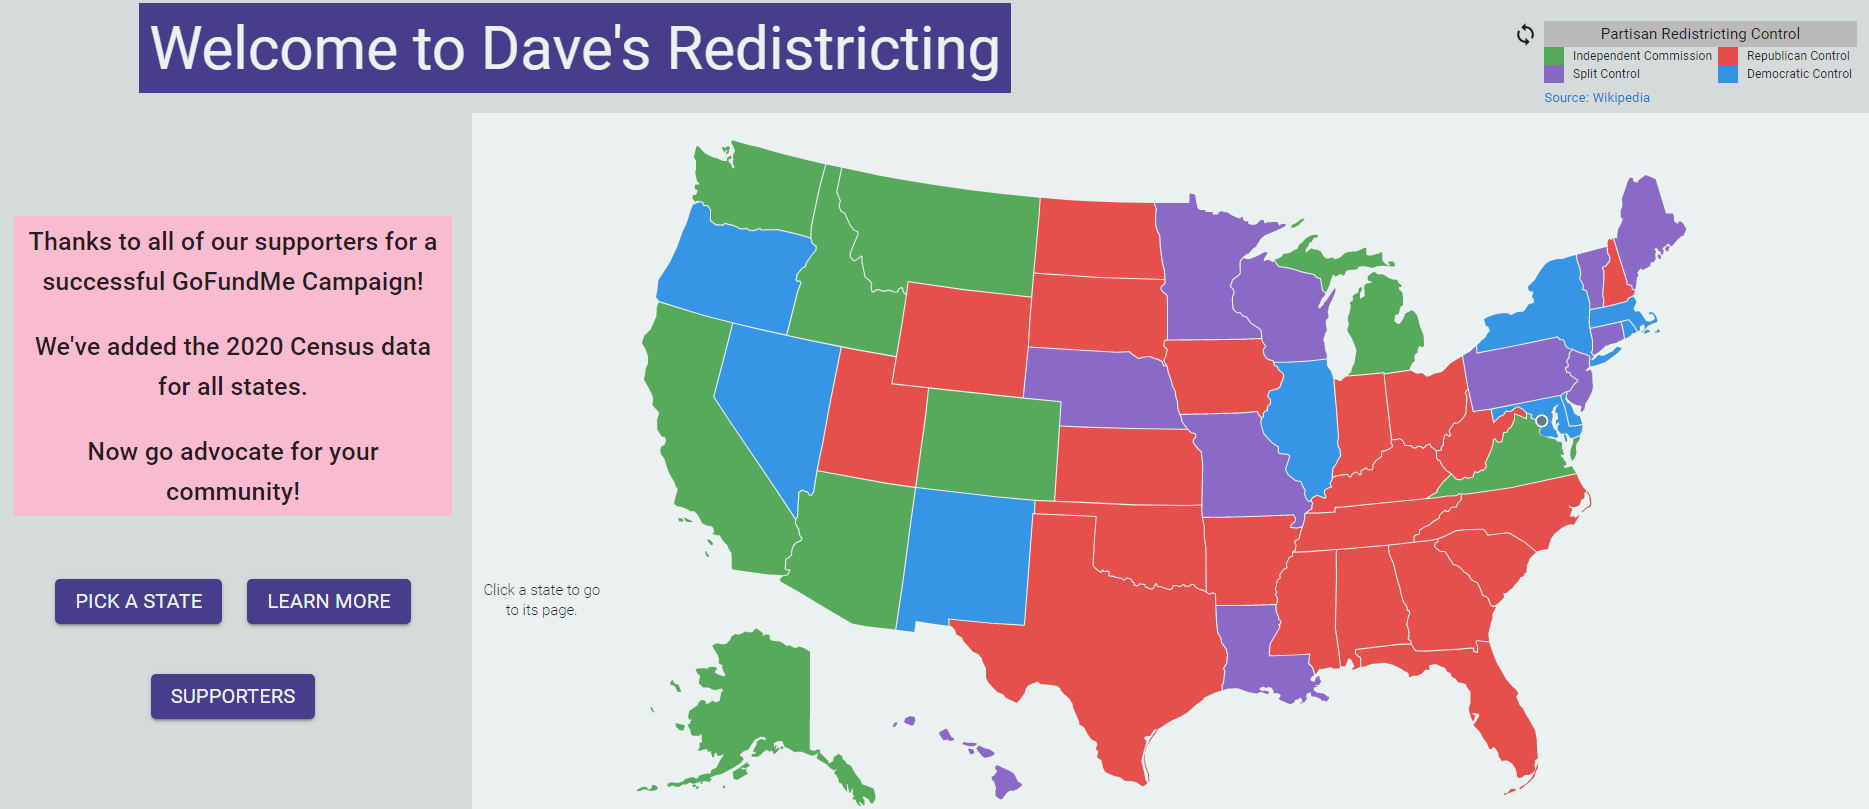
Mapping Software
There are multiple online apps available that allow users to examine and experiment with District boundaries. Dave’s Redistricting App 2020 (DRA2020) is the application with which I'm familiar. My use of DRA2020 is limited to the maps produced by the application developer. I have not ventured into the field of creating alternative maps.
DRA2020 uses the precinct 2020 geographic shape files released by the Census populated with data from the 2019 American Community Survey (ACS), an ongoing survey of the Census Bureau. DRA2020 then produces statistical overviews of these maps including an assessment of the required criterion of equal population. DRA2020 also provides several maps that result from emphasizing selected specified criteria. The result of the latter is a set of map models that would result should, for example, “compactness” or “effective minority representation” be identified as the key map making criterion.
Because the map is populated with 2019 data, the statistics and assessment in relation to selected criteria can be seen as foreshadowing the 2020 official 2020 Census results. Official district maps must be based on the 2020 Census results which were made available to states on August 12th, but we can gain some insight into where mapping may need adjustment as a result of population changes by using the lens of the statistics available in DRA2020. We also need to assess the impact of the past General Assembly session’s action to end the practice of “prison gerrymandering”.
New Maps for US Congressional Districts
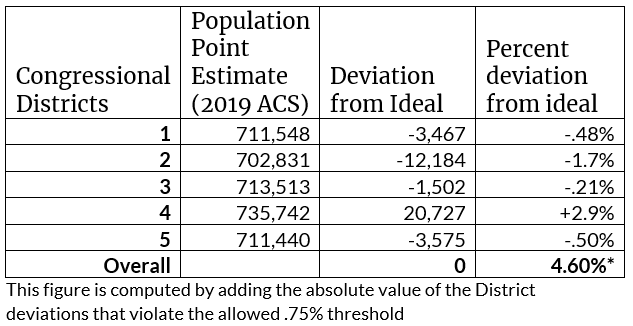
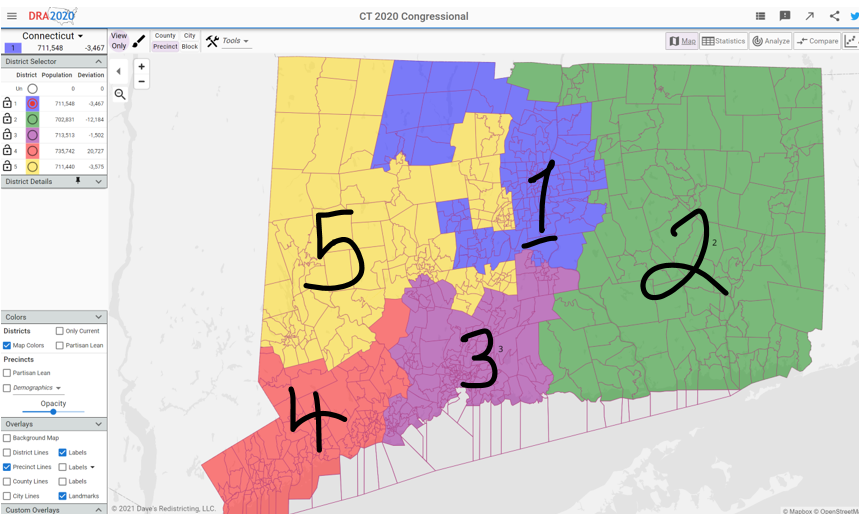
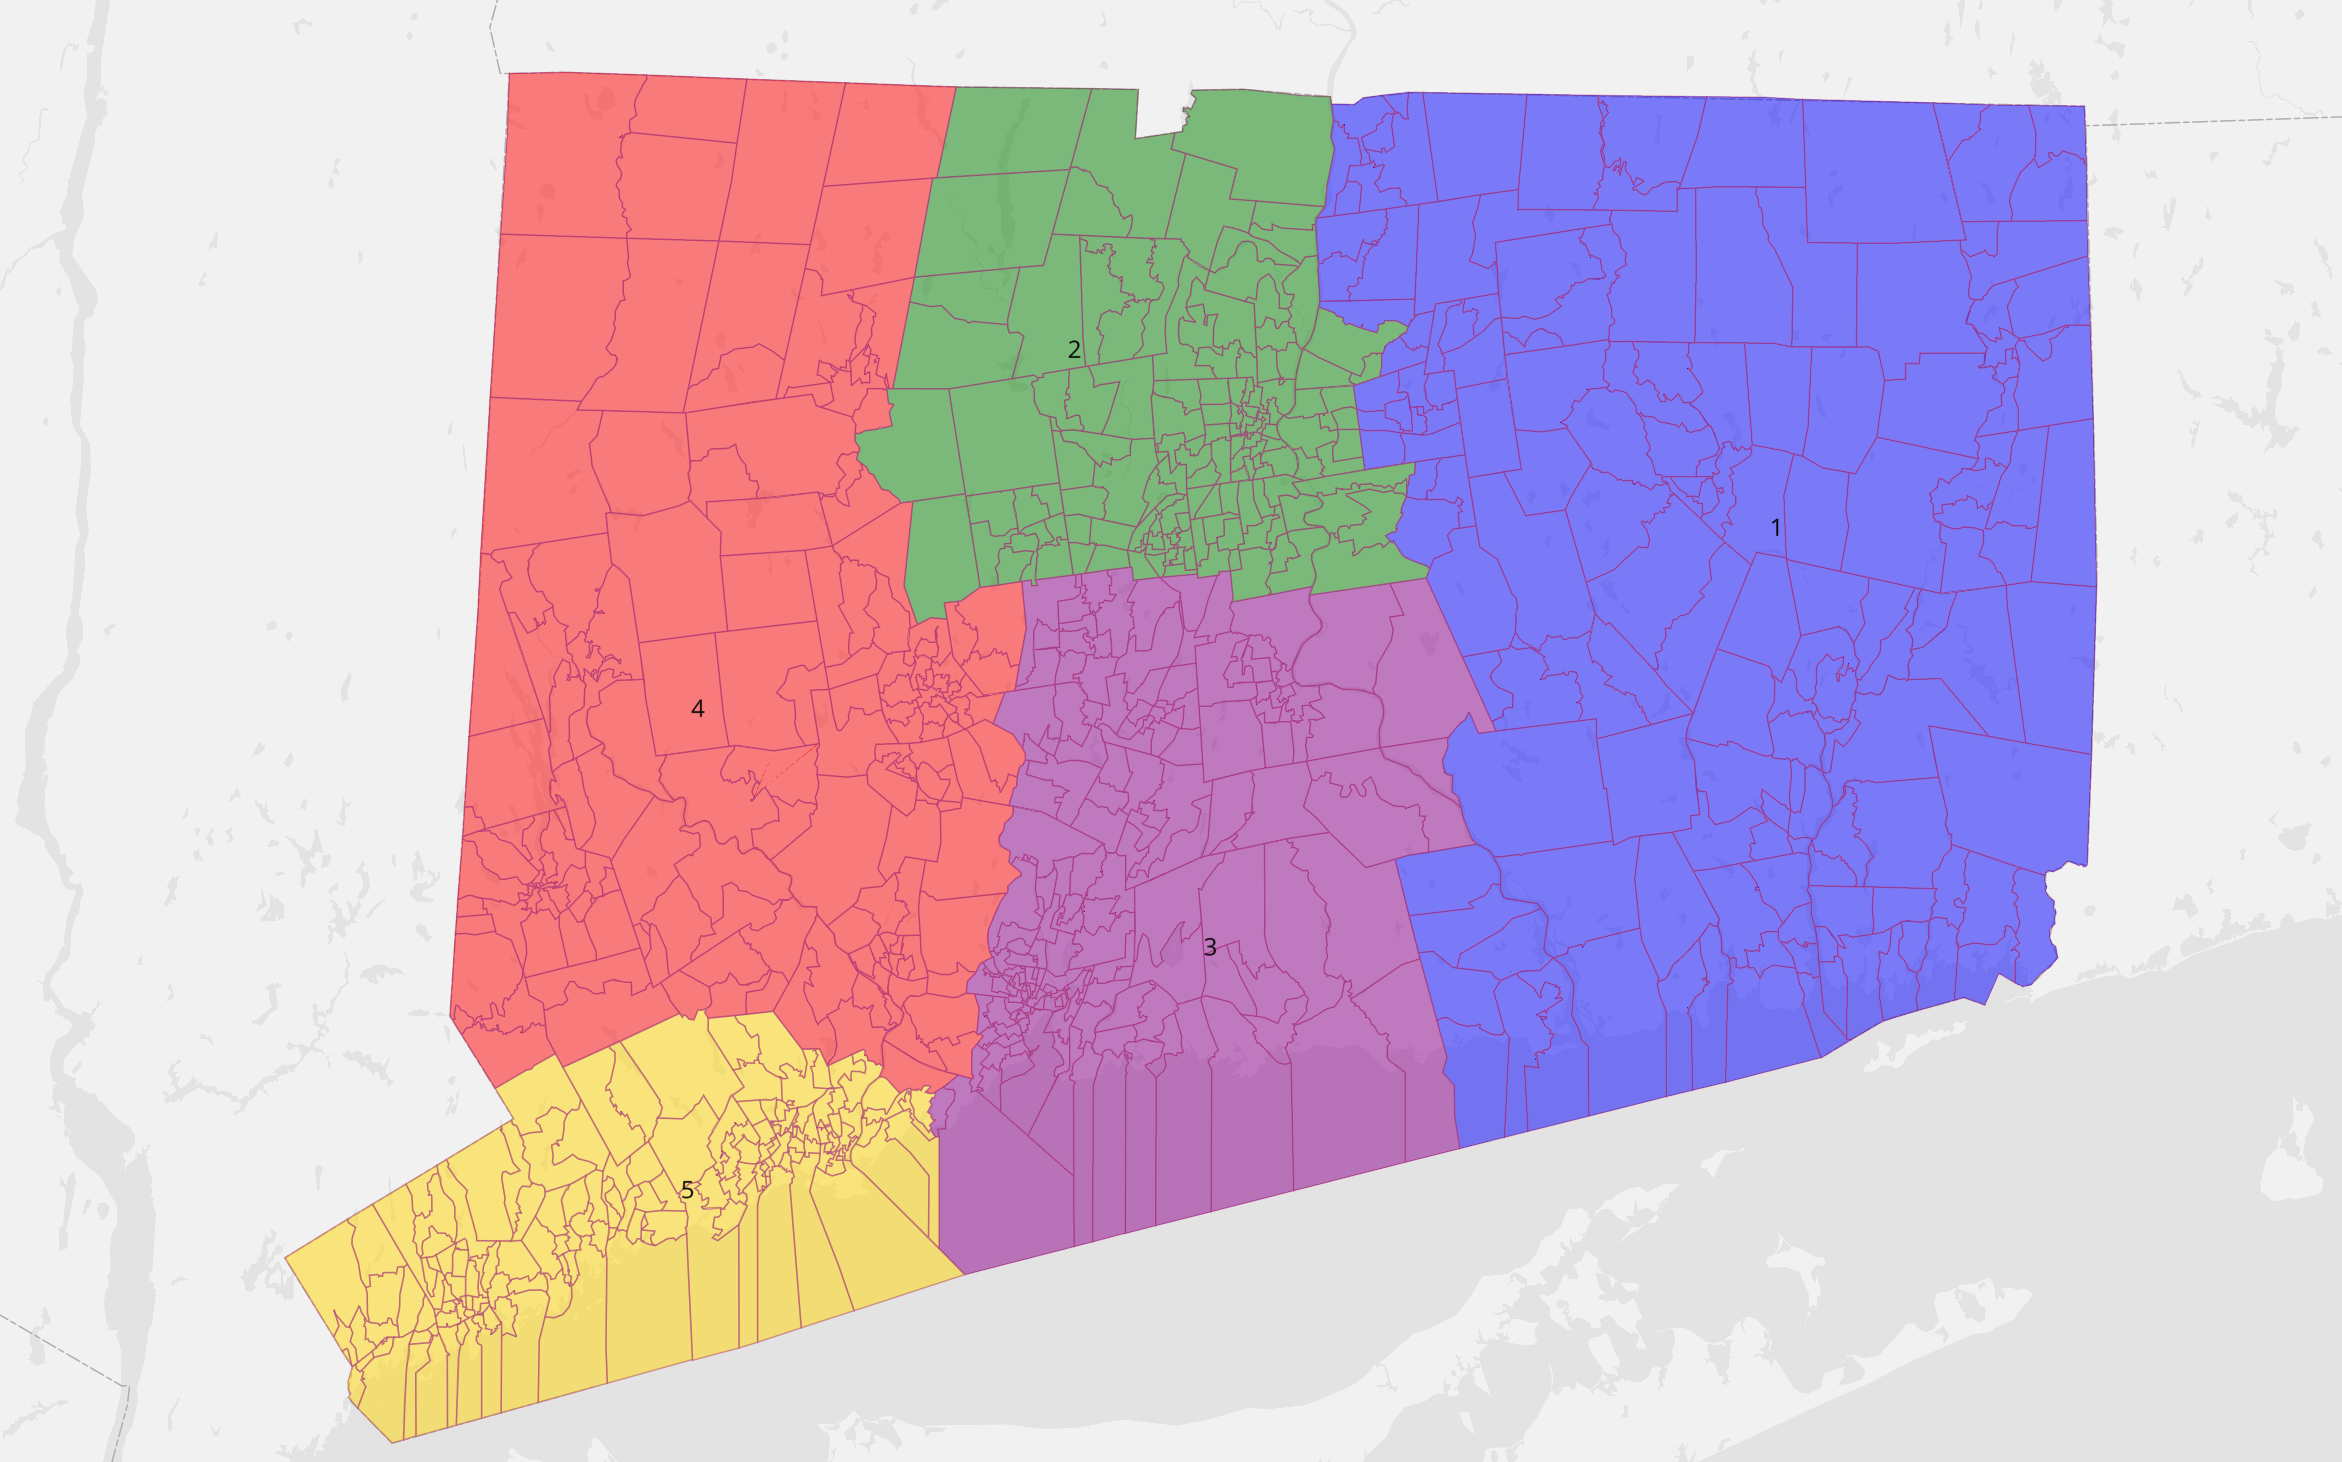
Let’s first take the example of the five U.S. House seats in CT. The 2019 population estimate for CT is about 3.5 million. The “ideal” district population is computed by dividing the total population by the number of districts for the given representational district: Congressional, State Senate and State House. Table 1 shows those results and we will focus first on the five Congressional districts. We see that the average or “ideal” population is just over 715 thousand people. In Table 2 we see the estimated population for each Congressional district. We see that District 4 (using 2019 population estimates) exceeds the average population by almost 21,000 people. Map 1 reminds us that Congressional District 4 is in the Southeastern section of the State and includes 17 towns and cities. We also need to monitor District 2 since, using 2019 estimates, its population also violates the allowable deviation from the state average; the District 2 population is less than the ideal district population.
Criterion: Equality of Population
We are now able to identify our first matter to which to be alert: Namely, the possible population inequality among Congressional districts, keeping in mind that the official Census 2020 data release may modify this result. DRA2020 highlights this inequality in the Statistics tab indicating that “The 4.6% population deviation is greater than the 0.75% threshold tolerated by the courts.” (This figure is computed by adding the absolute value of the District deviations that violate the allowed .75% deviation.)
Recall that inequality of district population violates the principle of equal representation, often referred to as the “one person, one vote” principle. The principle is violated using these data – but remember this is an estimate! - because District 4 simultaneously has more residents but the same number of representatives, namely 1. District 4 would be UNDER represented in this scenario. Using this information along with our map and adhering to the principle of contiguity, we can see that the opportunity for adjustment is found among Districts 4, 3 and 5. Our other example, District 2, has fewer residents with the same number of representatives, so it would be OVER represented in this scenario. District 2 is contiguous with Districts 1 and 3.
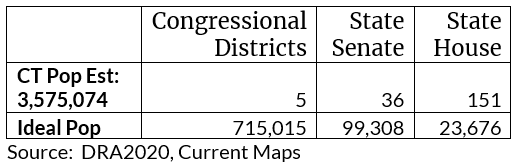
Table 2: CT Congressional District Population
Map 1: Connecticut Congressional District map (DRA2020, Current Maps)
Prison Gerrymandering
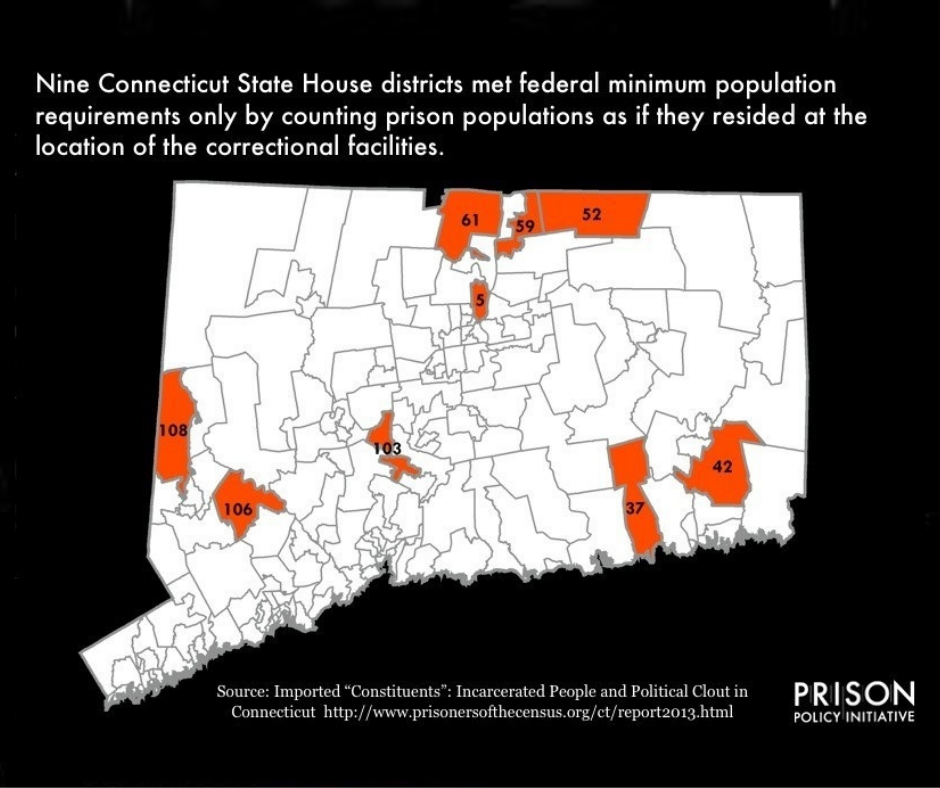
With respect to equality of population, we also need to be alert to the impact of policy changes that will or are likely to affect Redistricting. One such policy change is the elimination of the practice of prison-based gerrymandering. The Prison Policy Initiative of Common Cause lists the towns of Cheshire, East Lyme, Enfield, Somers and Suffield as the towns that hold the majority of the state’s prison cells. A 2013 PPI analysis identifies 9 state House districts meeting minimum population requirements only through the use of prison gerrymandering, as shown in Map 2.
Map 2: House Districts potentially affected by elimination of prison-based gerrymandering
Criterion: Partisan Lean
Partisan lean measures compute an average of multiple statewide election results to measure political party preferences on a statewide basis. In the case of CT, DRA2020 uses the 2012 and 2016 Presidential elections. Averaging these results, statewide partisan lean in CT is 57.95% for Democrats, and 42.05% for Republicans. The same elections’ two party vote split by district is then characterized according to its relationship to the statewide partisan lean average: Where the district vote split is 45-55% (in either direction), the district is characterized as Competitive. Vote splits of 55%+ are characterized as LD or LR depending on the party that has achieved that threshold. See the DRA2020 CT State Senate Statistics Page.
We can also assess partisan lean by reviewing the Secretary of the State’s (SOTS) 2020 state nominees list to determine how many candidates were unopposed by a major party opponent. I summarize those counts according to political party. Please remember however that this represents only one election cycle and formal partisan lean measures should include more. I cross-referenced counts based on the SOTS nominee list to counts I derived from lists on Ballotpedia; these are also included in Table 3.
Criterion: Effective Minority Representation
None of the measures available through DRA2020 measures Voting Rights Act Section 2 compliance. DRA2020 map statistics do show us which districts meet the Majority-Minority District criterion of >=50% minority citizen voting age population. Majority-Majority districts have been used to operationalize the concept of “effective minority representation.” Proponents argue that Majority-Minority districts are needed to counter the gerrymandering tactic called “cracking” in which minority populations are distributed across multiple districts; further they have resulted in increased number of minority representatives thus advancing effective minority representation. Opponents counter that such districts are subject to “packing” which can minimize the impact of racial minority voting blocs (https://ballotpedia.org/Majority-minority_districts).
Table 3 summarizes these three criteria. In the “Equality of Population” row, I list the districts that violate the threshold for the given type of district as found by looking at the DRA2020/Connecticut Current Maps/Statistics for each type of district. The partisan lean metric is defined above and I summarize the number of CT districts with a given type of partisan lean by type of district also using the DRA2020 Statistics tab. Similarly for Majority-Minority districts, I show the number of CT districts that meet the criterion as previously described.
Table 3: Connecticut districts summarized on selected criteria
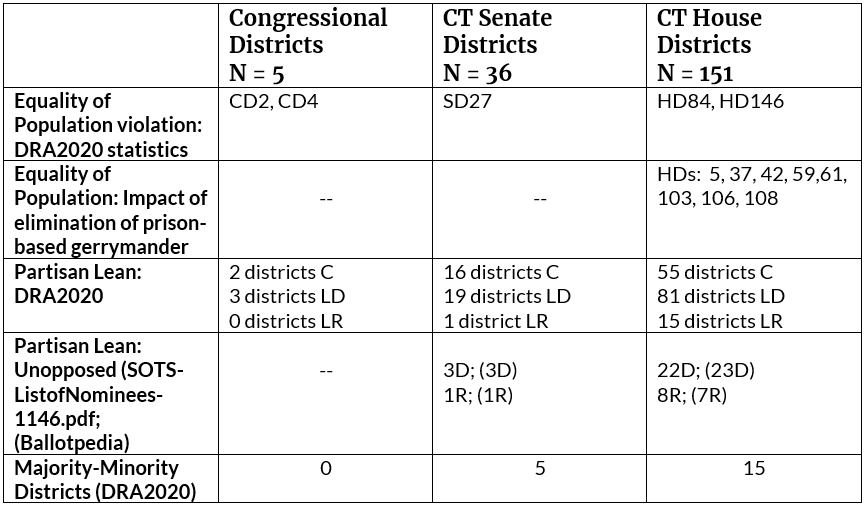
C = Competitive; LD = Lean Democratic; LR = Lean Republican
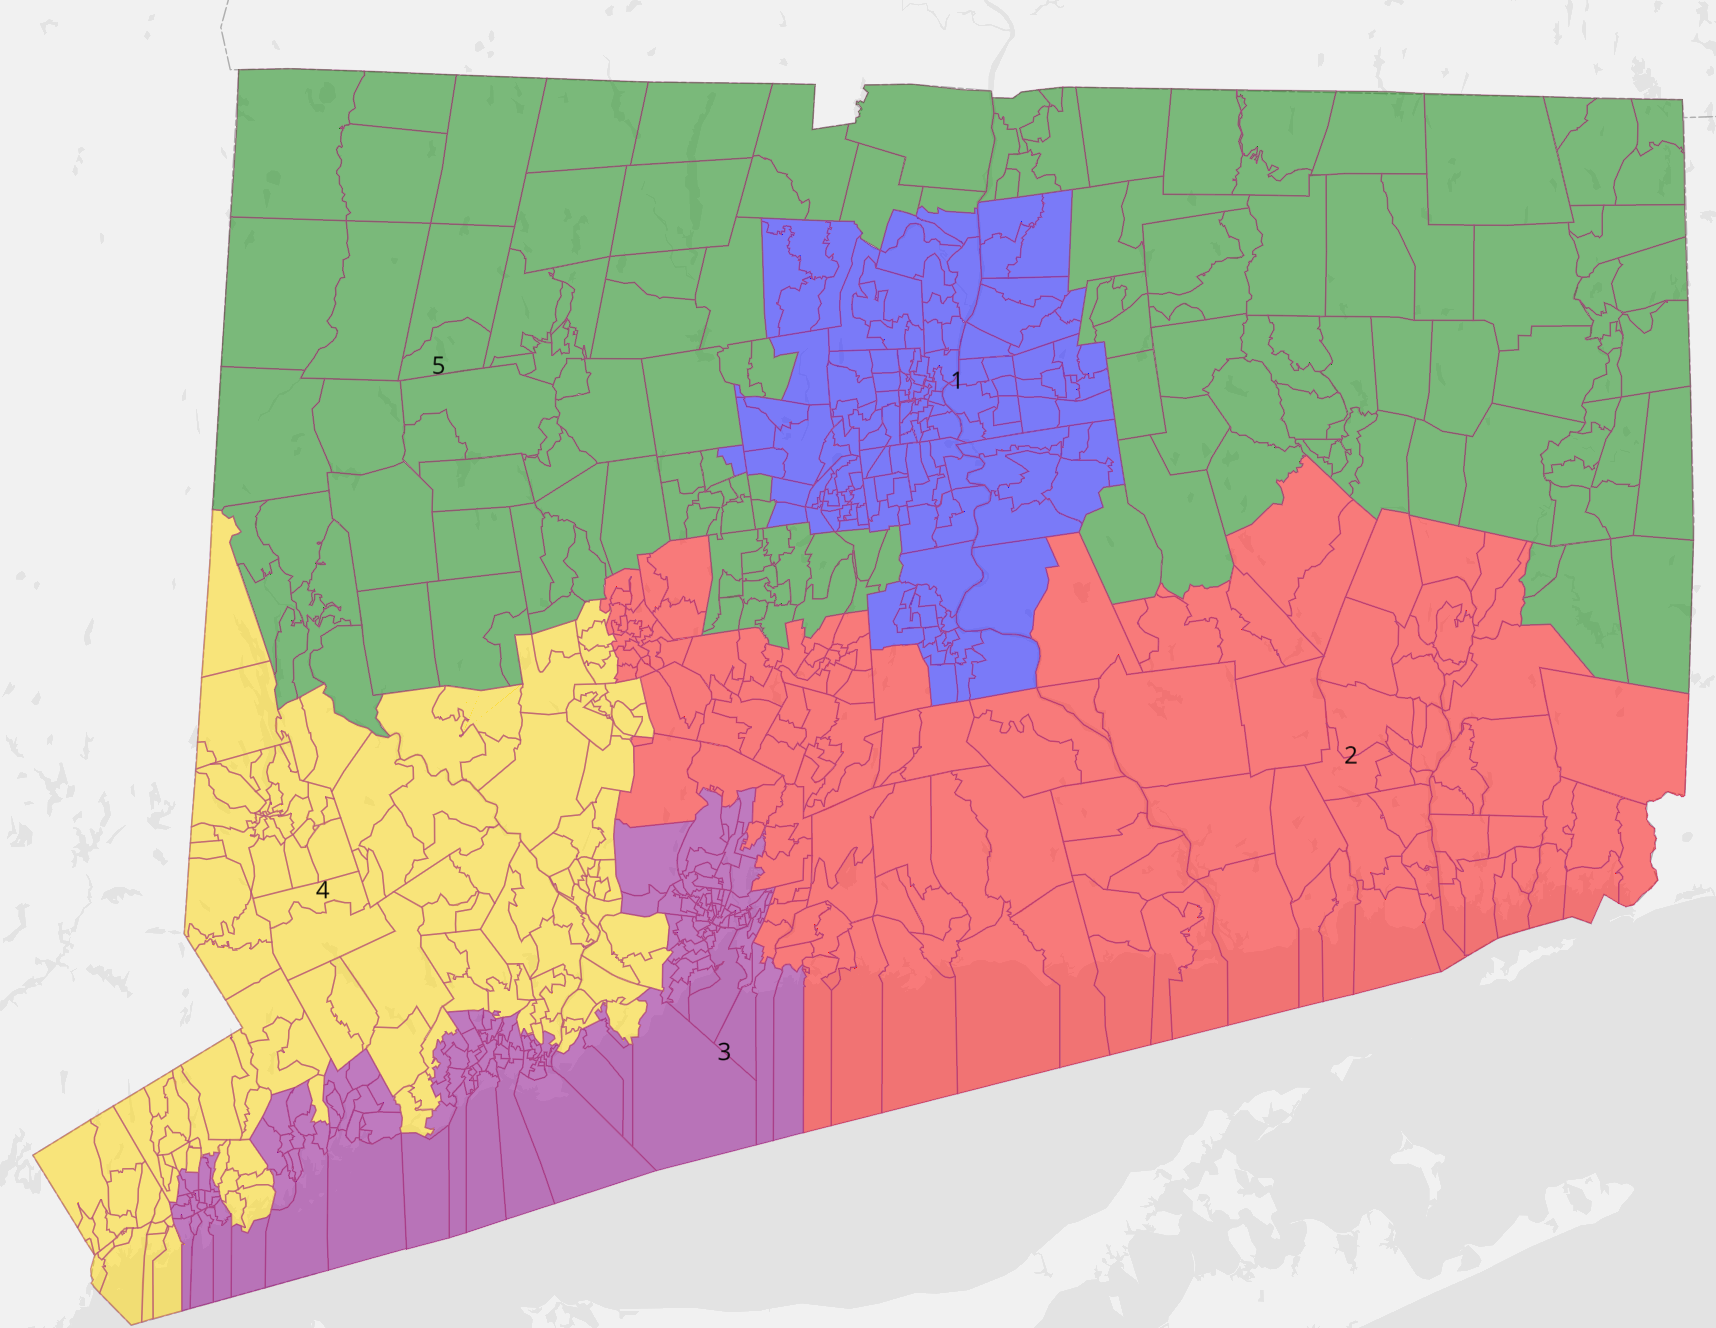
Finally, DRA2020 also provides a series of maps called “Notable Maps.” These maps show Congressional, State Senate and State House maps that result when a given criterion is prioritized. We can see, for example, how CT Congressional districts would look if “effective minority representation” were prioritized or if “compactness of shape” were prioritized. It is helpful to look at these variations to be reminded that the maps of our representational districts are not inevitable, that they are socially constructed based on map makers’ decisions within the context of federal and state law and policy. I encourage you to check them out; here are a couple of examples of alternatively prioritized Congressional districts to whet your appetite.
Most Compact
Most Effective Minority Representation
Summary
Clearly, the construction of fair representational districts is not an exact science. The series of “Notable Maps” available in DRA2020 reinforces our understanding of this fact. This is the most compelling reason why the work of Redistricting should take place in the clear light of day. Voters should choose their legislators rather than legislators choosing their voters and they should be aware of the discussions legislators are having. For this 2021 Redistricting cycle, there is no opportunity to change the established Constitutionally defined process. What we can do is speak up and ask targeted questions of those who are charged with creating the District maps. We must also continue to state the League’s position that Independent non-political Commissions are the better way to conduct decennial Redistricting.
The next and last article in this Redistricting Summer Series will offer some targeted messages, questions you can raise, and actions you can take to bring the League voice and position to the Redistricting process.
Action you can take today:
- Contact me at redistricting [at] lwvct.org if you are interested in an overview of Dave's Redistricting App 2020
- Spend some time delving into the resources about Redistricting criteria