A Closer Look at How Gerrymandering Works
Imagine a town with two parties: the Stripers and the Dotters. The two parties compete for the town council’s five seats, each elected from its own district. Their town has 50 voters, 20 in the Striper Party and 30 in the Dotter Party. Due to a new census showing population shifts, they need to redraw the council districts. Their consultants have come up with three possible maps, shown below.
The Dotters really like Map 2, which gives them all five seats. They currently hold a majority of the seats in the council, so they hope to get this map adopted.
The Stripers, however, are the majority party in the legislature. In their state (and in North Carolina), the legislature can draw the town’s electoral maps. The Stripers push for Map 3, which gives them 60% of the seats, even though they have only 40% of the voters.
To keep the peace, both parties might agree they would rather just get safe seats for all their preferred candidates by splitting control of the town council. Then they would pick Map 1, where each council member is surrounded by like-minded voters who will vote for his or her party every time.
A major downside to each of these choices is that, even though the town is fairly evenly split between Dotters and Stripers, the map is drawn so that every seat is uncompetitive. This makes running in the primary more attractive for challengers from the party that holds the advantage. If they can win the primary, they are a shoo-in to win the seat. In general, party loyalists make up a large share of primary voters, and they tend to be more ideologically driven than the average voter. Thanks to gerrymandering, they don’t have to worry about winning over members of the other party in the general: victory is assured. Over time, this can lead to fewer moderate candidates in office from either party, polarization in elected bodies, and less ability to compromise and move the town forward.
What Do You Think of These Options?
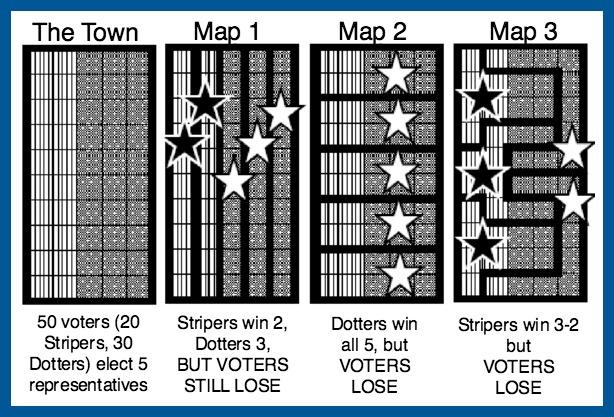
Map 1 might look good at first glance: Stripers get 2 and Dotters get 3, exactly reflecting their share of the votes. But five safe seats mean no competition, and no choice for voters.
Map 2 was drawn by the Dotters so they will WIN ALL 5! Two out of five voters are Stripers, but they can never win even a single seat.
Map 3 was drawn by the Stripers to guarantee a Striper majority (3-2), even though they have far fewer voters. Note that this awkward outcome shows the contorted borders characteristic of gerrymandering, even though each party’s base of support is just a plain rectangle.