Hingham Voter Turnout Data 2000-2017
YEAR |
Population eligible to register to vote (data is from June of each year) |
Registered Voters (pre-Town Meeting and Local Elections) |
Number of Voters at Town Meeting: Night 1/2/3/4 |
Number of Voters participating in local April election |
Presidential primaries and elections; State Primaries/elections: Number/% of those registered (NOTE: The “total registered” figures in this column are as reported by Town Clerk at time of each election and differs slightly from column C) |
|
2017 |
18,318 |
17,138 |
817/473 |
4034 |
------------------------------------- |
|
2016 |
18,200 |
16,802 |
584 |
2045 |
|
|
2015 |
17,842 |
16,353 |
492 |
4709 |
------------------------------------- |
|
2014 |
18,011 |
16,596 |
510 |
2976 |
|
|
2013 |
17,962 |
16,153 |
1818/310 |
4952 |
|
|
2012 |
17,525 |
16,153 |
653/365/568 (traffic lights on 3rd night) |
3660 |
|
|
2011 |
17,369 |
15,939: 16,079 (Special- OCT; Middle School; High School Fields; +) |
675/343; 2,329 |
2446; Special (Prop 2 ½ override)-OCT; 5437 |
------------------------------------- |
|
2010 |
17,146 |
15,731 |
1318/1293/2007 |
4410 |
|
|
2009 |
16,613 |
15,322; 15,444 (special-naming of East School) |
1206/367; 1535 |
4698 (Prop 2 ½ override) |
|
|
2008 |
16,839 |
15,245; 15,466 (special-new school) |
436; 1259 |
2467; 3495 (Prop 2 ½ override for new school) |
|
|
2007 |
16,630 |
15,056 |
519/324 |
1642 |
-------------------------------------- |
|
|
New Voting Machines | (ovals vs. arrows) | |||
|
2006 |
16,573 |
14,925; 15,068 (Special-Central Fire Station +) |
1007; 473 |
3046 |
|
|
2005 |
16,260 |
14,339 |
1001/833/840/359 “record-breaker”--Town Clerk |
3212 |
-------------------------------------- |
|
2004 |
N.A. |
14,615 |
1151/300 |
3842 (Prop 2 ½ override) |
|
|
2003 |
N.A. |
14,337 |
524 |
525 |
---------------------------------------- |
|
2002 |
N.A. |
14,578 |
577 |
2,979 |
|
|
2001 |
N.A. |
15,025 |
701/471 |
2,995 |
---------------------------------------- |
|
2000 |
N.A. |
14,870 |
672 |
2,739 |
|
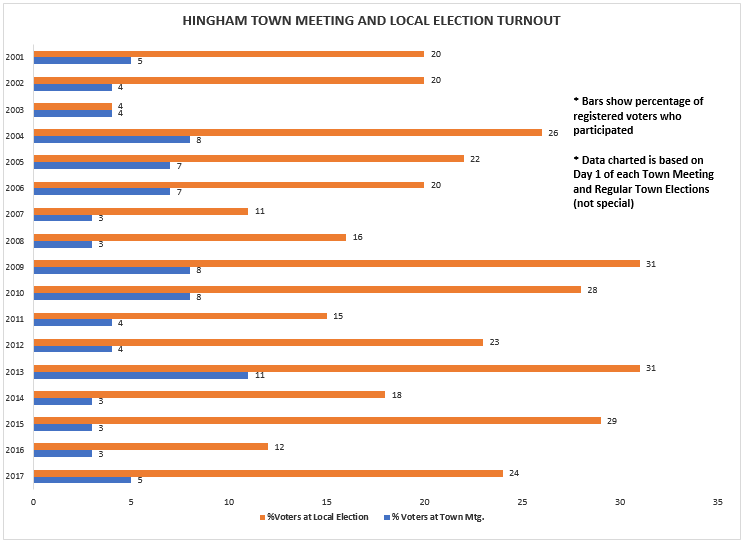
Bar Graph, Town Meeting and Local Turnout, 2001-2017